Introduction
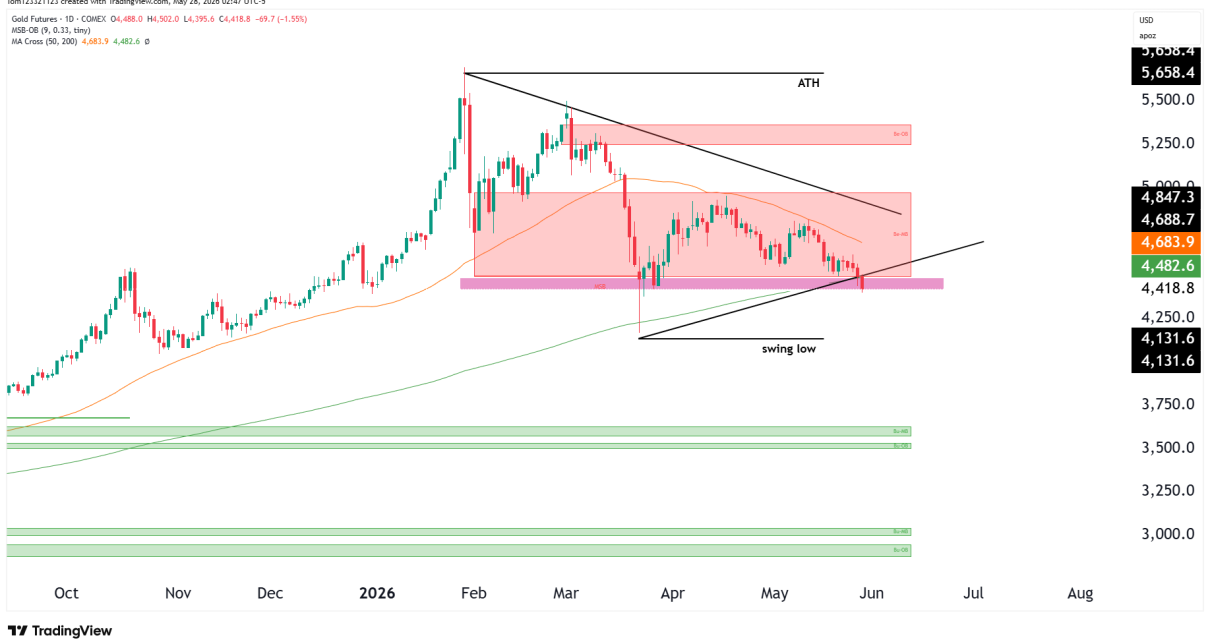
Gold futures have started to show some signs of weakness since our previous analysis. Since topping out near the 5,650 region, price has slowly moved lower while forming a series of lower highs on both the daily and weekly charts.
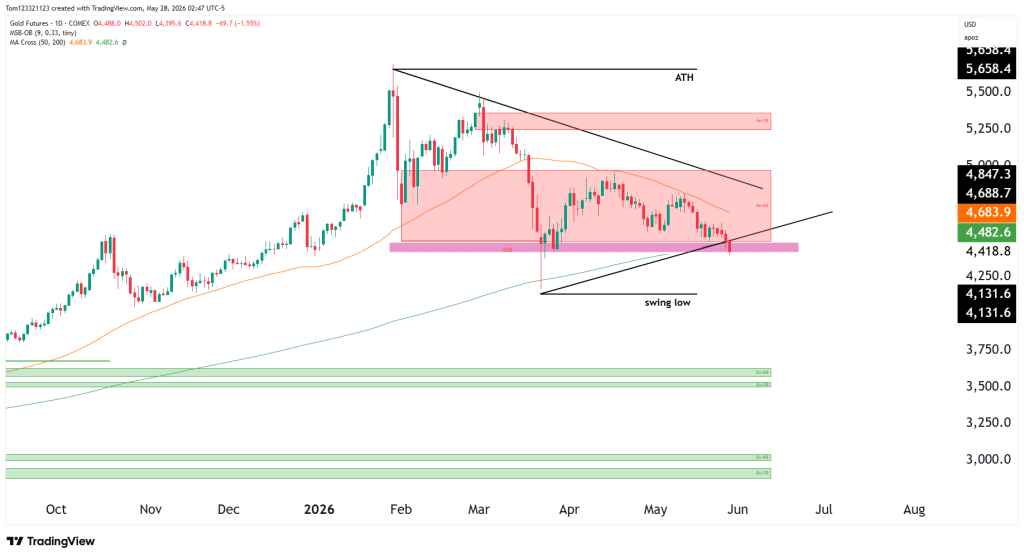
Right now, Gold futures are trading around 4,418 after breaking beneath an important support area that had been holding throughout May. The market is now sitting near a major trendline support zone, making the next few sessions important for determining whether buyers can stabilize price or if sellers continue pushing the market lower.
Gold Futures Trend Analysis
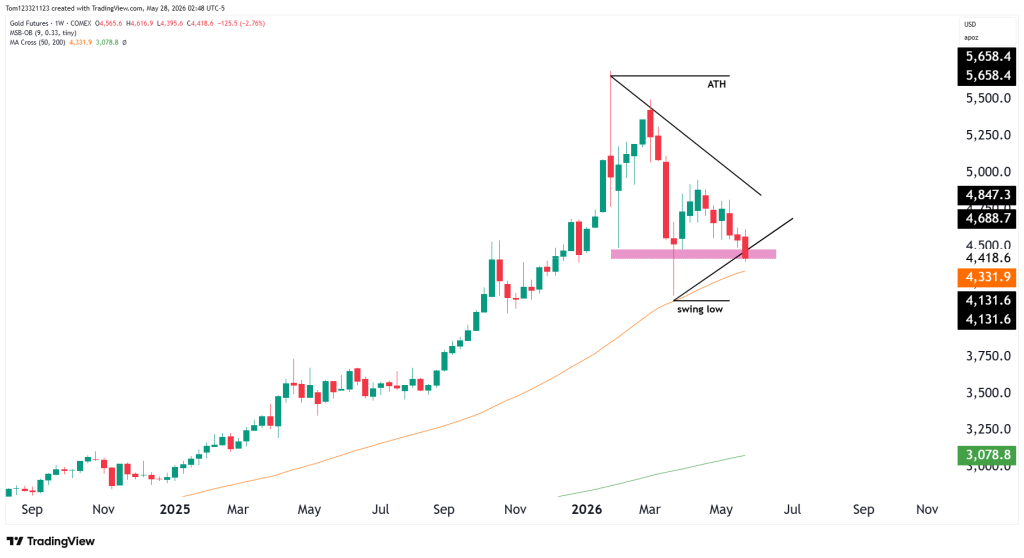
The bigger long-term trend still remains bullish overall, especially while price continues trading above the 200-day moving average. However, short-term momentum has clearly weakened over the past couple of months.
One of the biggest things standing out on the chart is the descending resistance trendline that has been controlling price since the all-time high. Every rally attempt since February has struggled to break above that trendline, showing that buyers are losing momentum as price continues consolidating.
At the same time, the market is now testing a major support region near 4,400 while also sitting close to an ascending trendline from the April swing low. This creates an important decision area where traders will likely watch closely for either a bounce or a larger breakdown.
Estimated Probabilities for Gold Futures
| Scenario | Estimated Probability | Market Interpretation |
|---|---|---|
| Continued decline below 4,400 support | 45% | Sellers maintain pressure and extend the pullback |
| Consolidation near current levels | 35% | Gold stabilizes before choosing direction |
| Recovery back toward 4,800 resistance | 20% | Buyers defend support and regain momentum |
Key Support and Resistance Levels
Major Resistance Levels
- 4,680–4,850
- 5,000
- 5,250
Major Support Levels
- 4,400–4,420
- 4,130 swing low
- 3,500–3,600 longer-term demand zone
Gold Futures Possible Trades
Bearish Continuation Trade
As long as Gold remains below the descending resistance trendline and the 50-day moving average, sellers may continue controlling short-term momentum. A clean break below the 4,400 support zone could open the door for a larger move toward the 4,130 swing low.
Support Bounce Trade Setup
The current support area remains important because buyers have defended this region multiple times recently. If bullish rejection candles or stronger buying volume begin appearing near support, Gold could attempt a short-term recovery bounce back toward the moving averages.
Bullish Recovery Trade
If buyers manage to reclaim the 50-day moving average and break above the descending trendline resistance, momentum could begin shifting back to the upside. In that case, traders would likely start watching the 4,800–5,000 region again for the next major resistance test.
Let us know your thoughts in the comment section below.
This analysis is provided for educational and informational purposes only and should not be considered financial or trading advice. Trading futures, forex, and other leveraged financial instruments carries a high level of risk and may not be suitable for all investors. Past performance is not indicative of future results. Before making any trading decisions, conduct your own research, assess your risk tolerance, and consult with a qualified financial advisor if necessary.