Introduction
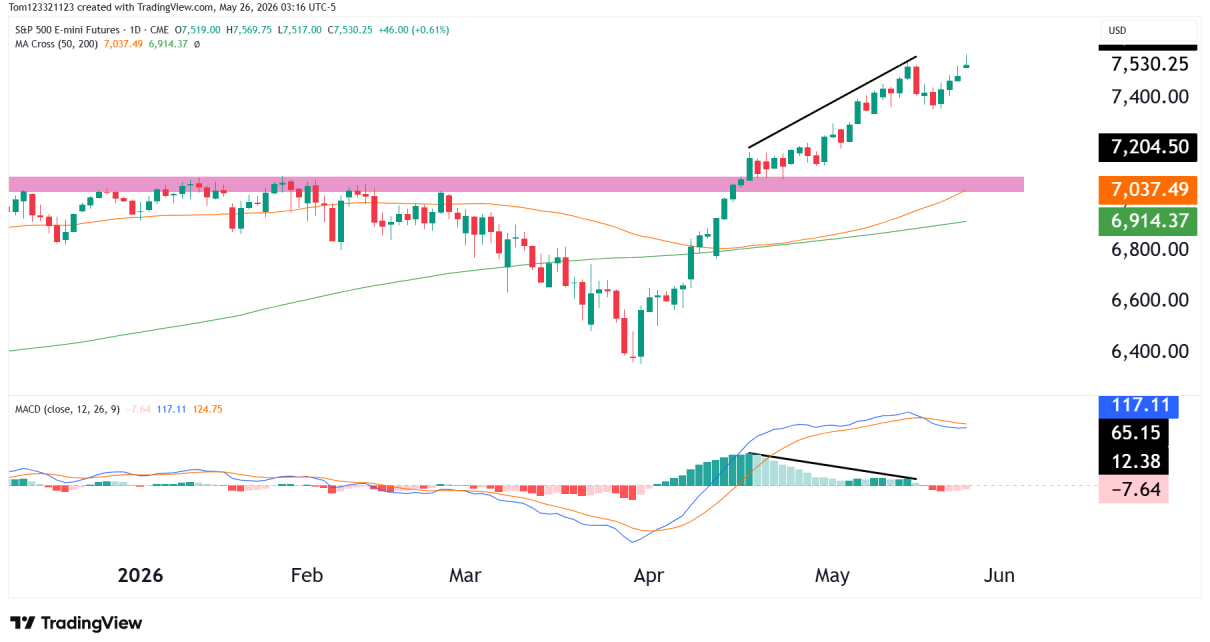
S&P 500 futures continue pushing higher as ES grinds toward fresh highs following the aggressive recovery from the April lows. Buyers remain firmly in control of the broader trend, with price continuing to hold well above both the 50-day and 200-day moving averages.
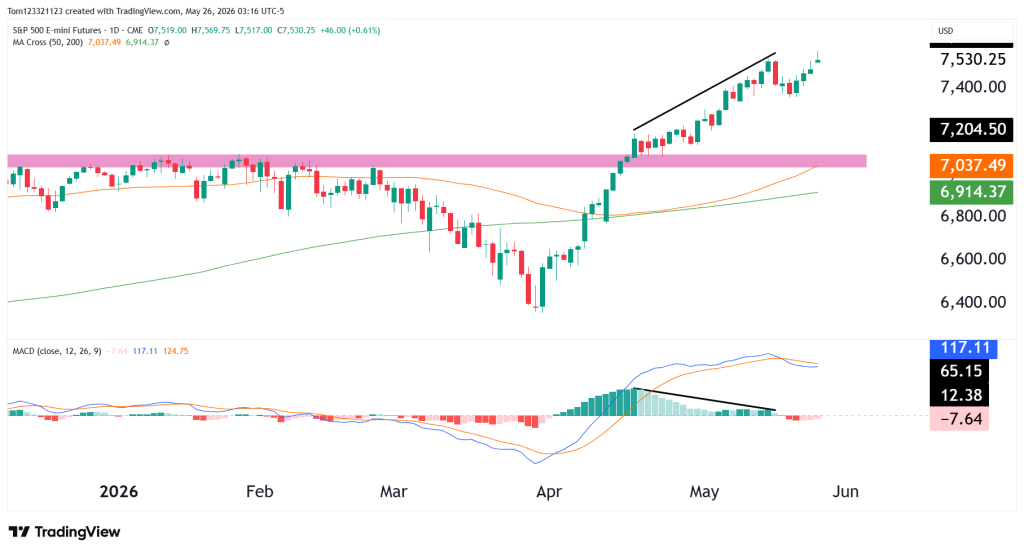
The current daily chart shows ES trading around 7,529 after reclaiming the previous breakout zone near 7,200 earlier this month. Momentum remains bullish overall, although the MACD is beginning to show signs of slowing as price continues climbing higher.
ES Futures Trend Analysis
The structure remains bullish right now. Since bottoming near the 6,400 region in April, ES has produced a near one-directional move higher with very shallow pullbacks throughout the rally.
Current technicals show:
- The 50-day moving average near 7,037
- The 200-day moving average near 6,914
- Current price trading around 7,529
- Previous breakout zone near 7,200 now acting as support
One of the most important technicals on the chart is the bullish continuation structure forming above the previous breakout zone. Buyers continue defending dips aggressively while maintaining higher highs and higher lows on the daily timeframe.
At the same time, the MACD is beginning to flatten and form slight bearish divergence while price continues making new highs. This does not necessarily mean a reversal is coming, but it could signal momentum cooling slightly after the aggressive rally during May.
MACD Momentum Starting To Slow
Estimated Probabilities for ES Futures
| Scenario | Estimated Probability | Market Interpretation |
|---|---|---|
| Continued breakout toward 7,700 | 55% | Buyers maintain momentum and continue trend higher |
| Consolidation above 7,200 support | 30% | ES pauses after the rally while maintaining bullish structure |
| Pullback toward 7,000 support | 15% | Momentum slows and triggers deeper retracement |
Key Support and Resistance Levels
Major Resistance Levels
- 7,600
- 7,700
- 7,800
Major Support Levels
- 7,200 breakout zone
- 7,037 (50-day moving average)
- 6,914 (200-day moving average)
ES Possible Trades
Bullish Continuation Trade
As long as ES remains above the 7,200 breakout zone, buyers continue controlling the trend. If momentum remains strong and price continues building above recent highs, we could see another leg higher toward the 7,700 region as buyers continue stepping into shallow pullbacks.
Pullback Trade Setup
Even after the aggressive rally, pullbacks into support may continue offering opportunities while the broader trend remains intact. Bullish rejection candles near the breakout zone, higher low formations, and momentum stabilizing after consolidation would all continue supporting the bullish structure.
Bearish Rejection Trade
Although the primary structure remains bullish, the slowing MACD momentum is something worth monitoring. If ES starts losing momentum near current highs and breaks back below the 7,200 support zone, we could see a larger pullback develop toward the moving averages.
Take Advantage of This 10% Discount & Start Your Evaluation Today!
This analysis is provided for educational and informational purposes only and should not be considered financial or trading advice. Trading futures, forex, and other leveraged financial instruments carries a high level of risk and may not be suitable for all investors. Past performance is not indicative of future results. Before making any trading decisions, conduct your own research, assess your risk tolerance, and consult with a qualified financial advisor if necessary.