


Introduction
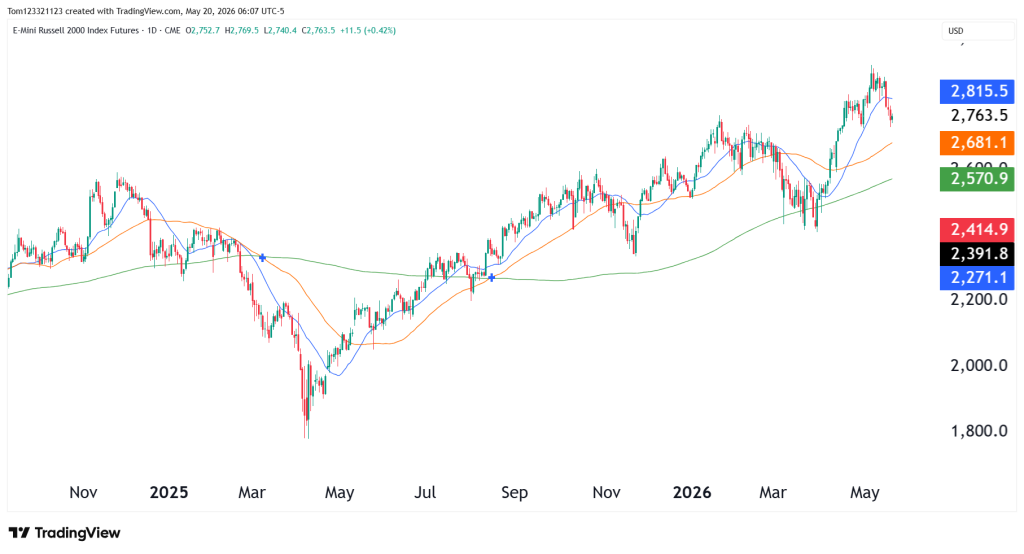
Russell 2000 futures are pulling back slightly after a strong rally that pushed RTY back toward the recent highs near 2,815. Small caps have shown impressive strength since the April lows, with buyers stepping back into the market aggressively following the recovery across U.S. equities.
The daily chart still shows a bullish structure overall, with RTY trading above the 50-day and 200-day moving averages despite the recent short-term weakness. We are now closely monitoring whether this pullback develops into a healthy retracement or the beginning of a bigger correction after the move higher.
RTY Futures Trend Analysis
RTY has remained in a strong recovery trend since bottoming near the 1,800 region back in April 2025. Since then, the market has continued building higher highs and higher lows while respecting the longer-term moving averages.
One of the most important technicals on the chart is the recent rejection near the 2,815 resistance zone. Buyers pushed aggressively into new highs during May but have started showing signs of exhaustion in the short term.
Even with the recent pullback, the broader trend remains bullish while price continues trading above the 50-day and 200-day moving averages.
Estimated Probabilities for RTY Futures
| Scenario | Estimated Probability | Market Interpretation |
|---|---|---|
| Bullish continuation toward new highs | 45% | Buyers defend support and resume the uptrend |
| Consolidation between 2,680 and 2,815 | 40% | RTY pauses after the recent rally while maintaining bullish structure |
| Deeper pullback toward 2,570 support | 15% | Sellers gain momentum and trigger larger correction |
Possible Trades
Bullish Continuation Trade
If we see price test the 50 day moving average and bounce, it could be a signal to go long. Another way to play it is to slowly accumulate from here while the market has pulled back. It is important to keep in mind, though, that RTY is more volatile than the bigger indices, so moves are more exaggerated.
Bearish Rejection Trade
Although the larger structure remains bullish, traders could monitor for signs of increasing weakness after the recent rejection near highs.
Potential bearish signals:
- Breakdown below the 50-day moving average
- Lower highs forming on the daily timeframe
- Increasing selling pressure near resistance
- Expansion in downside volatility
Interest Rates and Small Cap Volatility
Russell 2000 futures are highly sensitive to interest rate expectations and overall economic growth conditions. Small-cap stocks generally have higher volatility than large-cap indices, especially during periods of uncertainty surrounding Fed policy.
If market sentiment remains supportive and economic data stabilizes, RTY could continue participating in the US equity rally. However, rising yields or slowing growth could pressure small caps more aggressively than the larger indices.
Final Thoughts
Keep an eye on the 50 day moving average. As long as price remains above that, RTY is bullish, even a move below that doesn’t rule out the bullish trend, it could just be a deeper pullback. Shorting at this time looks higher risk than going long because it will be fighting the trend directly. Remember to always follow your trading plan.
This analysis is provided for educational and informational purposes only and should not be considered financial or trading advice. Trading futures, forex, and other leveraged financial instruments carries a high level of risk and may not be suitable for all investors. Past performance is not indicative of future results. Before making any trading decisions, conduct your own research, assess your risk tolerance, and consult with a qualified financial advisor if necessary.