


Introduction
Crude oil has been in price-discovery mode for 4 weeks since the start of the conflict in the Middle East and appears to be finding some stability now.
This is a meaningful shift. In the previous analyses, the focus was on whether crude would consolidate or retrace after the explosive move. Instead, the market is printing higher highs and higher lows now.
Lets take a closer look at the technicals and what they are telling us.
What Has Changed Since the Last Analysis
Crude was previously moving sideways between $90 and $100, but that range has now broken to the upside.
Price has pushed above $100 and managed to stay there. It has also built a solid base around that level, without dropping back toward $90 in any meaningful way.
The takeaway is to respect strength when you see it. When a market breaks out and holds above a key level without pulling back much, it often means demand is strong. Trying to fade that too early can be risky. It’s usually better to wait for clear signs of weakness rather than assume a reversal just because price has already moved up.
Market Structure & Trend
Daily Timeframe – Bullish Continuation Structure
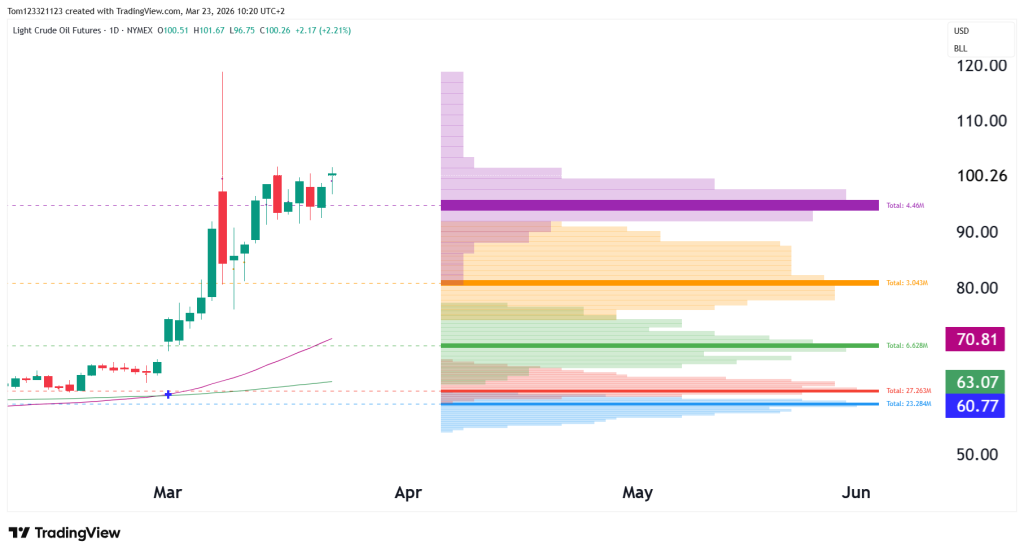
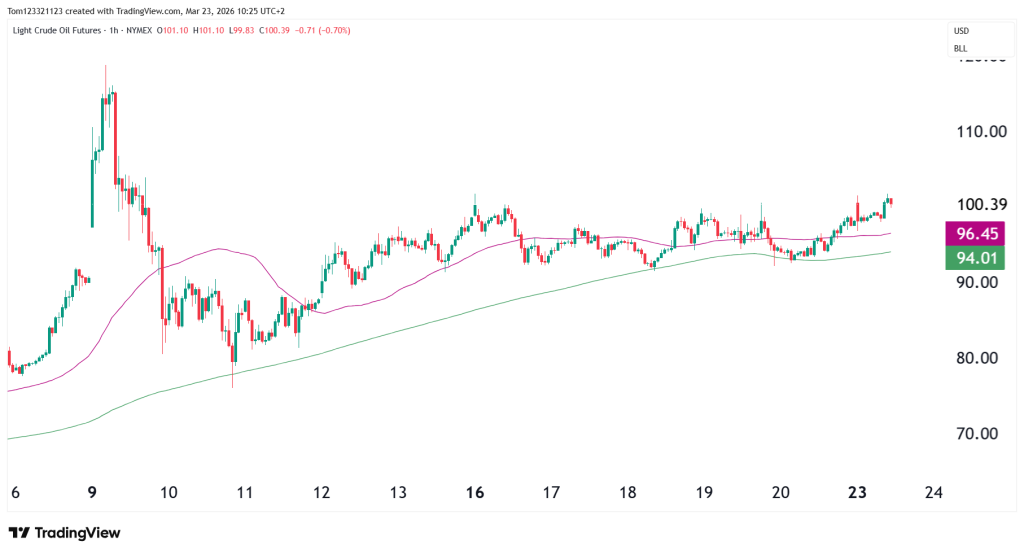
The daily chart shows that price is starting to find its footing. Price discovery is slowing down after the initial volatile phase in the middle east. Higher highs and higher lows are forming both on the daily chart and shorter time frames like the hourly.
Looking at the volume profile indicator there is also room to the upside with low volume nodes above $100 which price generally moves very quickly through.
The high at the initial spike is at $118, if price clears that level, it is likely we will see CL targeting $130 and even eventually $150, but this is all extremely dependent on the conflict in the Middle East. If suddely that had to stop and the routes for oil transport were opened again like normal, we could see a crash in price. It is important for traders to keep this in mind.
Timeframe Context
- Daily: Strong bullish structure, consolidation near highs
- Intraday: Likely rotational moves around $100 with breakout attempts
Key Technical Levels
Resistance
$101–$102 (Current highs)
Immediate resistance. A break above this level opens the door for continuation.
$110–$120
Prior spike region. This becomes the next major target zone if momentum expands.
Support
$95–$97
Strong support and high-volume area. First level to watch on any pullback.
$90
Previous range high. A break below this would weaken the bullish structure.
$80–$85
Major value area and deeper support zone.
Possible Trades
- If price holds above $100, bias remains bullish
- If price breaks above $102, expect expansion toward $110
- If price loses $95, the market may rotate back into the prior range
Probability Table
| Scenario | Description | Estimated Probability |
|---|---|---|
| Bullish Continuation | Break above $102 leads to move toward $110–$120 | 45% |
| Consolidation | Price holds between $95–$102 and builds structure | 35% |
| Bearish Pullback | Break below $95 leads to move toward $90 | 20% |
Final Takeaway
The recent price action shows that most of the situation in the middle east has been priced in for now. Moving forward, any developments in that region and including transportation of crude is going to be the main driver for the price, if not the only driver right now.
We can keep an eye on technicals but they are likely only for possible targets as price moves higher, they should not be the main point traders base their decisions on.
Keep a close eye on the news and monitor your risk.
This analysis is for educational and informational purposes only and does not constitute trading advice or a recommendation to buy or sell any futures contracts. Futures trading involves significant risk and may not be suitable for all investors. Always conduct your own research and consult with a licensed financial professional before making trading decisions.
