


Introduction
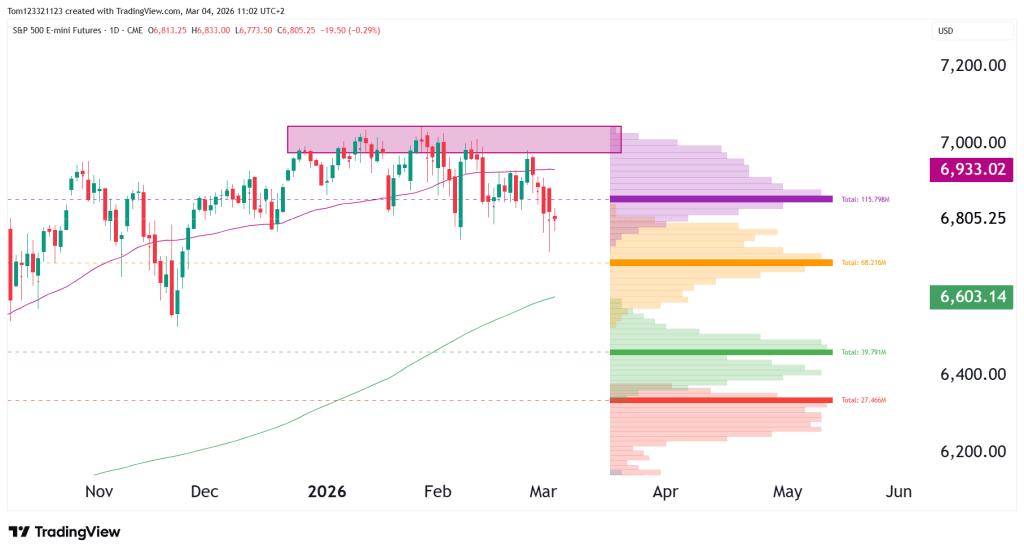
S&P 500 E-mini futures (ES) have started to lose upside momentum after repeatedly failing to break the 7,000 resistance zone, which was its all-time high. The market is now drifting lower toward the 6,800 region, with the developments in the Middle East having no major effect on US equities. The strength of the Dollar recently has had a small effect on the value of ES, but it is not something major to take note of.
Market Structure & Trend
Daily Chart – Range Distribution
The chart currently shows a large range structure:
Upper Range:
~6,950 – 7,050
Mid Range:
~6,860 – 6,900 (POC) This is an important zone where the price is currently trading because it is the highest volume level on the volume profile. (Notice how price swings at this level, finding support or resistance there.
Lower Range:
~6,600 – 6,700
Key Technical Levels for ES
Resistance
6,860 – 6,950
- Volume profile Point of Control (115.8M contracts)
- Major institutional positioning level
- Rejection here recently triggered selling
Support
6,780 – 6,820
- Current reaction zone
- Short-term structural support
6,600 – 6,620
- Major volume node (~39.8M contracts)
- Strong historical demand
Scenarios Going Forward
Bullish Continuation
If geopolitical tensions stabilize and macro sentiment improves:
- ES reclaims 6,950
- Buyers attack the 7,000 supply zone
- Potential breakout toward 7,200
Important for this:
- War containment
- Lower oil prices
- Strong economic data
Controlled Pullback
Price rotates lower inside the range.
- ES tests 6,700–6,750
- Buyers step in
- Market consolidates before another push higher
Estimated Probability Table
| Scenario | Description | Probability |
|---|---|---|
| Range continuation | 6,700–7,000 consolidation | 45% |
| Controlled pullback | Test of 6,600 demand | 30% |
| Bullish breakout | Break above 7,020 | 15% |
| Risk-off selloff | War escalation drives drop below 6,600 | 10% |
Final Takeaway
The 7,000 region remains the key level for ES. Until price breaks above that with conviction, the market is stuck.
At the same time, war-related headlines could easily override technical signals, especially as they impact:
- Oil prices
- Global supply chains
- Central bank expectations
Important levels to watch this week:
- 6,950 → reclaim = bullish momentum
- 6,780 → breakdown trigger
- 6,600 → major demand zone
- 7,020 → breakout level
This analysis is for educational and informational purposes only and does not constitute trading advice or a recommendation to buy or sell any futures contracts. Futures trading involves significant risk and may not be suitable for all investors. Always conduct your own research and consult with a licensed financial professional before making trading decisions.