- Technicals appear bullish in the medium term for Gold.
- Analysis of the volume profile, Fibonacci retracements, and 100-day Moving Average.
- Entry and stop loss placement ideas.
Daily Chart Analysis
In our previous article, we indicated that even though Gold was rallying with strong intent, there was no point chasing the market, but rather ideal to consider waiting for a pullback before initiating a position. The RSI was overbought, which was a good sign that the Bulls were firmly in control, but we considered waiting patiently for the indicator to move out of overbought status. Go here to read the previous technical analysis piece on Gold.
Volume Profile
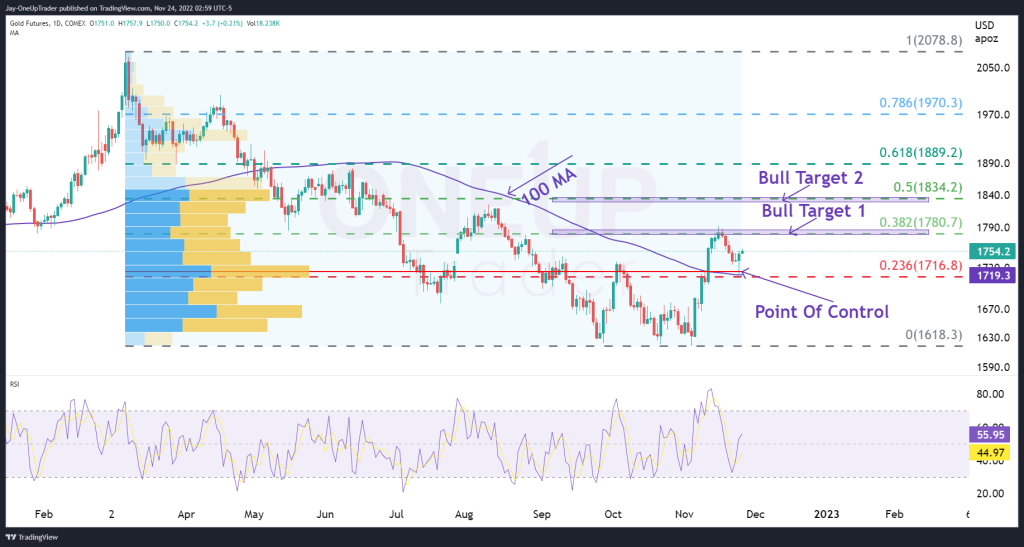
It appears the retracement is in as Gold bounced aggressively off the Point of control line for the volume profile indicator. The Point of control line indicates where the most volume has been traded on the chart for the specified range, and the price generally finds support and resistance off that mark. The strong bounce, coupled with the bullish candlestick from yesterday’s session, provides a decent case for the bulls.
Fibonacci Restracements
The gold price also found support on the 0.236 Fib retracement, which was at a very close price to the Point of control ($1,716.8). Looking at the Fib, the bullish targets are $1,780.7 (0.382 level) and $1,834.2 (0.5 level).
100 Moving Average
Gold was also bid up as soon as it touched the 100-day moving average (in purple) to add more conviction to the bull case.
Trade Ideas
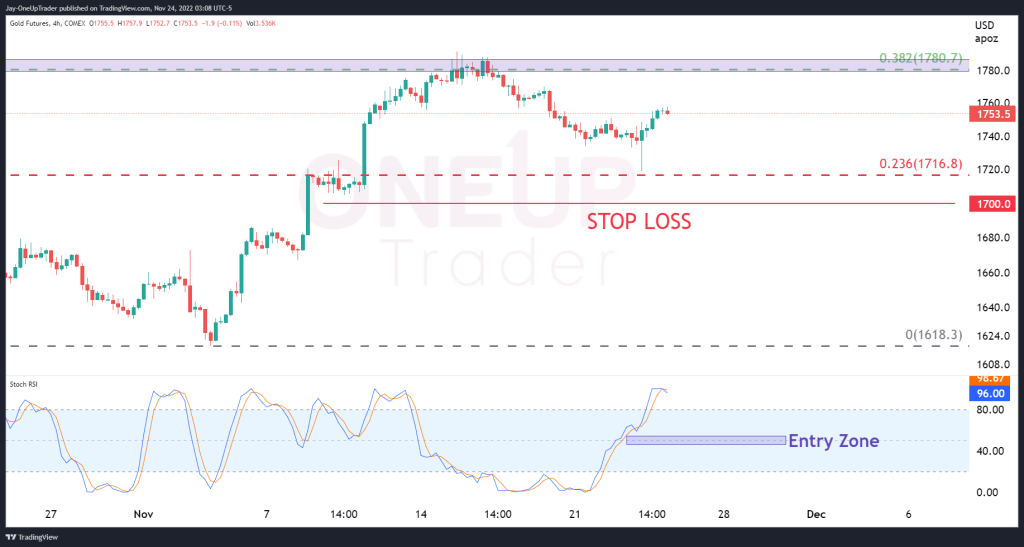
If a trader remains bullish on the Gold price and believes the move is not over yet, then there are a few areas on the chart to consider regarding stop placement and entries. If the price does fall below $1,716.8, then it’s not a good sign for Bulls, and stops around $1,700 would likely result in the bullish momentum coming to an end. This is not to say that the uptrend would be over, just that the initial momentum is slowing.
Entries could be taken when the RSI indicator retraces to the 50 line and crosses back above it, as seen in the chart below.