


Introduction
The E-mini Russell 2000 futures (RTY) continue to consolidate near recent highs after a strong rally that has lasted since April 2025. Unlike the S&P 500 and Nasdaq, which are pressing into more resistance, RTY is moving at a more gradual pace.
Without the bigger indices like ES and NQ rallying, it is more difficult for small caps to follow suit but for now, they are holding up better.
What is important to look at now is whether RTY is preparing for a bullish break or if we see it pullback more and follow the bigger indices. Let’s take a look at the chart and what we can learn from it.
Market Structure & Trend
Daily Chart
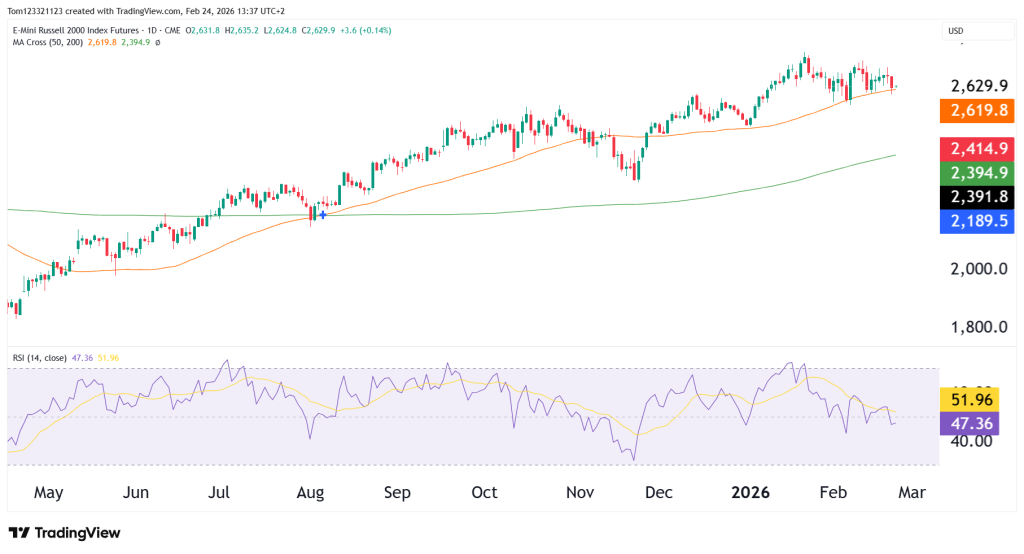
The daily timeframe shows:
- Price holding above the rising 50-day moving average (~2,620) and often finding support on it.
- The 200-day moving average rising steadily.
- Higher highs and higher lows intact.
- RSI drifting slightly below 50 (currently ~47), signaling short-term momentum cooling.
RTY recently pushed into the 2,660–2,680 area and has since entered a tight consolidation phase just above the 50-day average.
As long as 2,600–2,620 holds, the short-term uptrend remains intact.
Weekly Chart
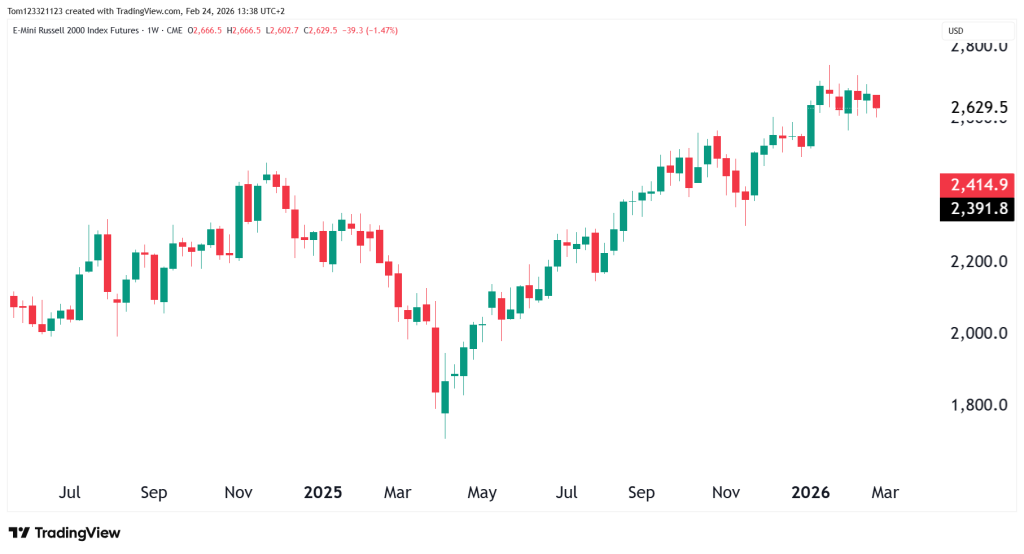
The weekly chart shows a strong recovery from the 2025 lows near 1,750.
Key chart elements:
- Clean sequence of higher highs and higher lows
- Strong impulsive leg from 2,200 to 2,650
- No major structural damage
- Momentum elevated but not extreme
We can see that on the weekly chart, there is only really opportunities to buy as there are no signs of a reversal. Bulls remain firmly in control.
Key Technical Levels
Resistance
2,650–2,700:
Near-term supply zone and recent highs. A weekly close above 2,700 would likely trigger upside expansion toward:
2,800:
Next psychological and measured extension target.
Support
2,600–2,620:
Short-term support and location of the rising 50-day average.
2,500–2,520:
Prior breakout structure and stronger demand zone if a deeper retracement unfolds.
Bulls want to see price remain above 2,500 in order for the momentum to continue in their favour.
Looking Forward
Bullish Breakout
Pushing above 2,700 and holding would confirm renewed upside momentum and open the path toward 2,800+.
Consolidation
Price rotates between 2,600 and 2,700 while momentum resets. This would be a healthy move and likely give a chance for a stronger breakout in the future.
Estimated Probability Table
| Scenario | Description | Estimated Probability |
|---|---|---|
| Consolidation | Range 2,600–2,700 | 40% |
| Bullish breakout | Break above 2,700 | 35% |
| Corrective pullback | Break below 2,600 | 25% |
Final Takeaway
Bulls remain firmly in control of RTY. 2,700 and above could lead to a stronger move and the possibility of 2,800. 2,600, however, is the support; a break below there puts the bullish momentum into jeopardy.
Until one of those levels breaks with conviction, we can expect a range-bound market.
This analysis is for educational and informational purposes only and does not constitute trading advice or a recommendation to buy or sell any futures contracts. Futures trading involves significant risk and may not be suitable for all investors. Always conduct your own research and consult with a licensed financial professional before making trading decisions.