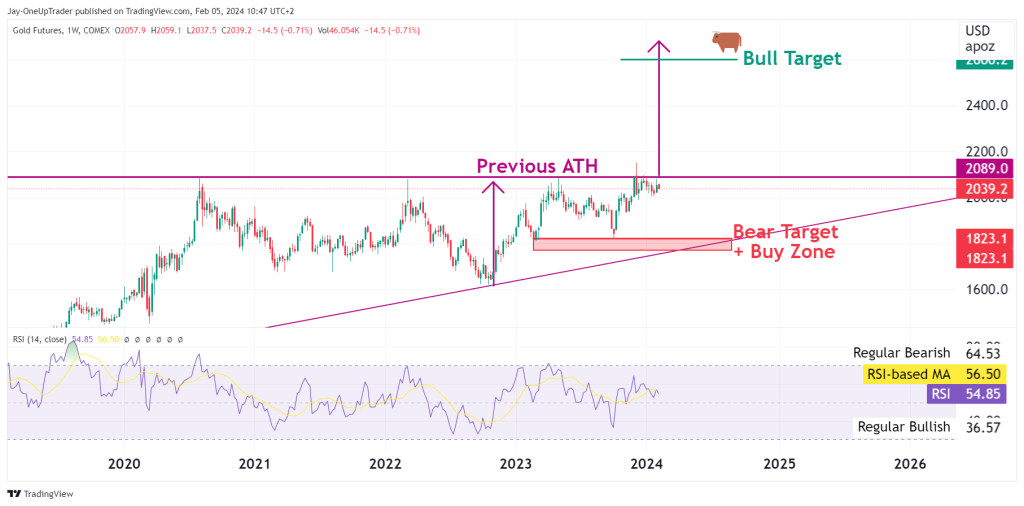
Weekly Chart Analysis:
The weekly chart shows a consolidation below the previous all-time high (ATH) with most dips generally being bought back up. The resistance level to watch is the previous ATH at $2089.0. A decisive weekly close above this level could signal a bullish continuation, potentially targeting the bull target zone around $2400.0. However, should the price fail to breach this level, we may see a pullback toward the bear target and buy zone at around $1823.1, which is the bottom of the ascending trend line.
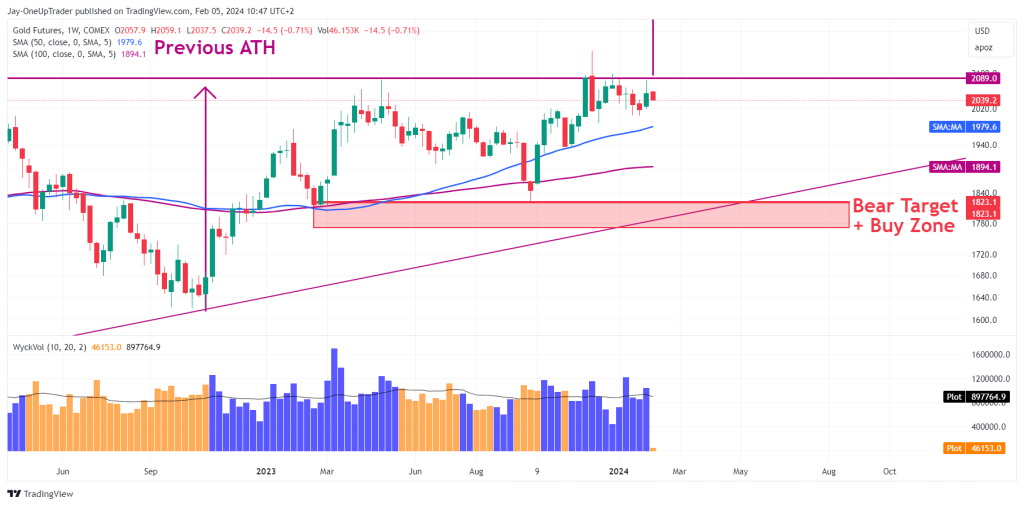
Daily Chart Analysis:
The 50-day SMA at around $1979.6 and the 100-day SMA at $1894.1 will be critical in determining the short-term trend and should act as support to maintain bullish sentiment. The ascending trianlge gives the bulls a higher probability currently. The Wyckoff volume shows a slight decrease in overall trade volume which is a sign of consolidation before a higher volatility move.
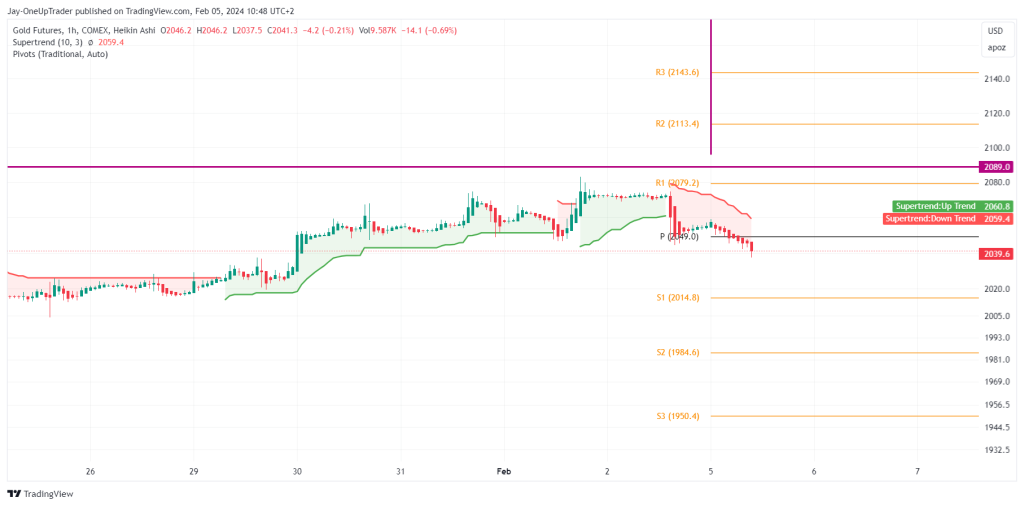
1-Hour Chart Analysis:
The 1-hour chart using Heikin Ashi candles shows a trend change with a shift towards red candles, indicating potential bearish momentum in the short term. The pivot point at approximately $2049.0 is the immediate support, with the traditional pivots R1 at $2079.2 and S1 at $2014.8, acting as short-term resistance and support levels, respectively. A break above R1 could signal an intraday bullish stance, while a drop below S1 may confirm further downside.
Key Levels to Watch:
- Bullish Scenario: A sustained move above $2089.0 on the weekly chart is key for a bullish outlook. Intraday, watch for a break above R1 ($2079.2) for confirmation of bullish momentum.
- Bearish Scenario: A failure to hold the pivot point at $2049.0 and a break below the S1 level at $2014.8 could open the door for a move towards $1823.1, the bear target and buy zone.
Potential Trades:
- Bullish Trade: Enter a long position on a weekly close above $2089.0, with a stop loss just below the breakout level, targeting the $2400.0 bull target zone.
- Bearish Trade: Enter a short position if there’s a 1-hour close below the pivot point at $2049.0, with a stop loss above the R1 at $2079.2, aiming for the S1 at $2014.8 as the first target.
Rating:
The overall rating is cautiously bullish based on the weekly chart’s proximity to the previous ATH and the daily SMA levels acting as support. However, the recent bearish indications on the 1-hour chart suggest that we should remain vigilant for a potential trend reversal. Monitoring the key levels mentioned will be crucial for confirming the market’s direction.