


Introduction
Crude Oil futures continue to rebound from the $55–56 support zone, with price now pressing into the mid-$60s. The bounce has been steady rather than explosive, but bullish action is clearly improving on both the daily and weekly timeframes.
After months of lower highs, the bulls are attempting to find a way higher and possibly break above the $70 level.
Let’s take a closer look at the technicals and see what they are telling us.
Market Structure & Trend
Daily Chart
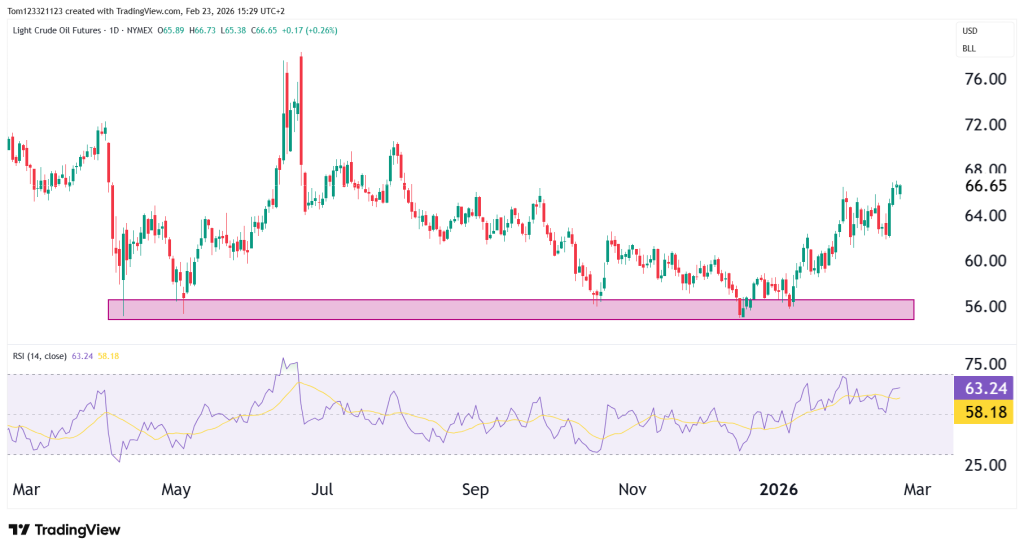
The daily chart shows a clear support in the $55–56 zone, which has held multiple tests since late 2025.
Recent developments:
- Higher low formed above $56
- Break above prior short-term lower highs
- RSI pushing into the low 60s (currently ~63)
- Stronger candle bodies with reduced downside wicks
Weekly Chart
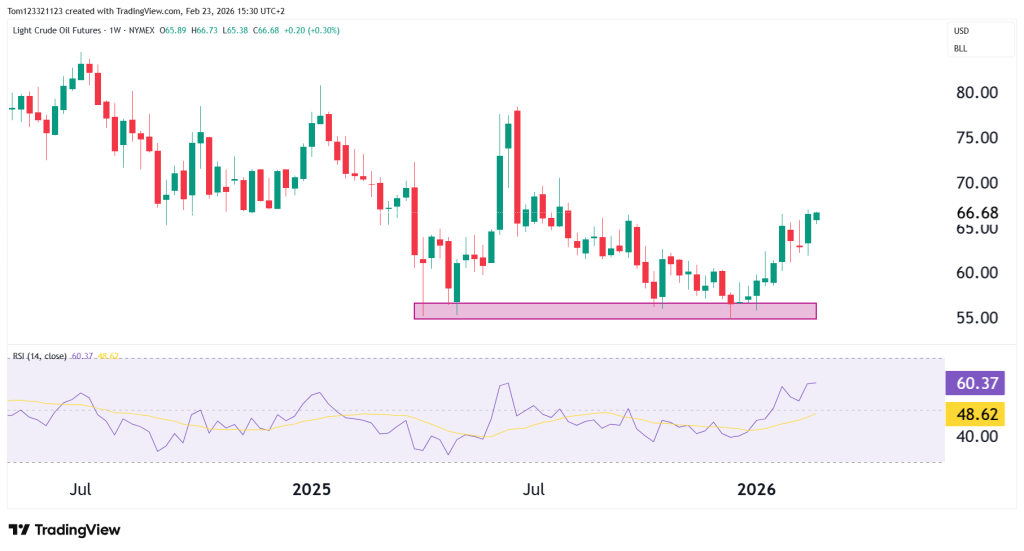
The weekly chart reinforces the importance of the $55 area. That level has now acted as:
- Major support
- Failed breakdown zone
- Multi-month base
RSI on the weekly has turned higher and is back above 60, suggesting improving medium-term momentum.
However, crude remains below structural resistance from the $70–72 area.
This remains a recovery phase inside a range until that level breaks.
Key Technical Levels
Resistance
$67–68:
Near-term supply and prior distribution zone. A clean break above this level opens the path toward:
$70–72:
Major structural resistance and prior breakdown zone. This is the level that would confirm a broader bullish reversal.
Support
$62–63:
Short-term support and prior breakout level on the daily.
$55–56:
Major structural support and demand zone. As long as this level holds, the medium-term recovery probability remains intact.
Looking Forward
Bullish Continuation
Acceptance above $68 opens upside toward $70–72. A weekly close above $72 would mark a major shift.
Controlled Pullback
Price retraces toward $62–63, holds, and resumes higher.
Failed Breakout
Rejection at $67–68 followed by a break back below $62 could return crude to a ranging market.
Estimated Probability Table
| Scenario | Description | Estimated Probability |
|---|---|---|
| Bullish continuation | Break above $68 toward $72 | 45% |
| Controlled pullback | Retrace, hold $62, resume higher | 35% |
| Failed breakout | Rejection and rotation lower | 20% |
Fundamentals to Watch
1. OPEC+ Policy
Any extension or deepening of production cuts would support price. Conversely, surprise output increases could cap rallies near $70.
2. U.S. Production Trends
Rising shale production can offset OPEC cuts and limit upside momentum.
3. Inventory Data (EIA Reports)
If weekly U.S. crude inventories begin trending lower consistently, it would reinforce the bullish structure. Persistent builds would challenge it.
4. Global Growth Expectations
Oil is highly sensitive to economic outlook. Stronger manufacturing data or improving China demand could support upside.
5. U.S. Dollar (DXY)
A weaker dollar generally supports commodities, including crude. A sustained DXY breakout higher could pressure oil.
Final Takeaway
Crude oil has clearly defended the $55 floor and is now attempting to recover.
Short-term momentum favors the upside but the real test sits at $70–72.
Until that level breaks, crude remains in range recovery.
Above $68, momentum likely expands.
Below $62, the rally risks stalling.
The next few sessions will determine whether this is just rotation — or the early stage of trend development.
This analysis is for educational and informational purposes only and does not constitute trading advice or a recommendation to buy or sell any futures contracts. Futures trading involves significant risk and may not be suitable for all investors. Always conduct your own research and consult with a licensed financial professional before making trading decisions.
