

- The weekly chart’s most prominent feature is the volume profile indicator which shows price trading within a high-volume node.
- There are two minor support zones below the current price of 6E as well as a trend line which may hold the price up.
- The markets wait for the Fed meeting coming on 25th August.
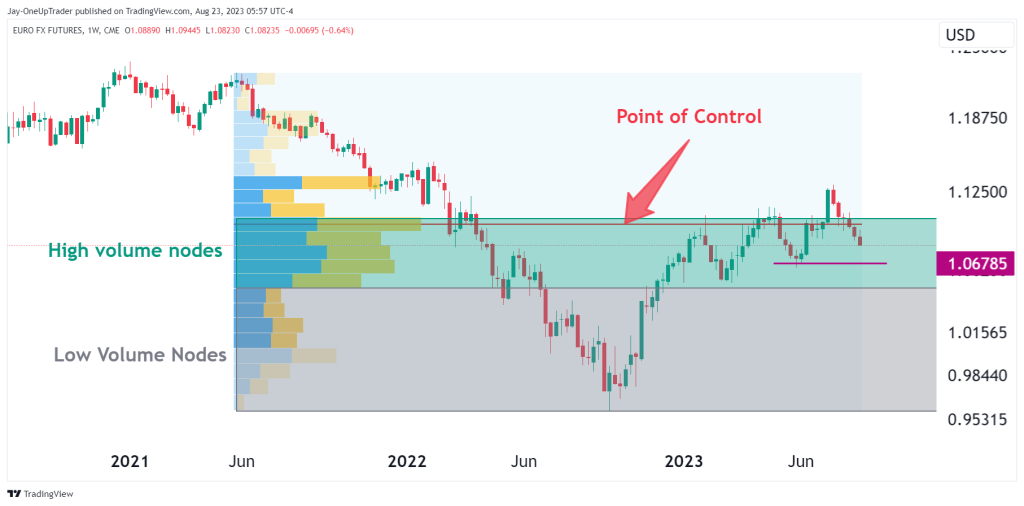
Weekly chart
The main feature we can look at on the weekly chart is the volume profile indicator. The Euro has struggled to break above the point of control line and has begun to retrace from it as it acts as resistance. Currently, 6E is trading within a high-volume node. You can see this by the high volume bars on the left of the chart, and the rectangle in green across the price action. The grey bar represents the low-volume nodes which, if price does move into it, will accelerate a lot quicker. Price might find some support at 1.067, so let’s look at that on the daily time frame.
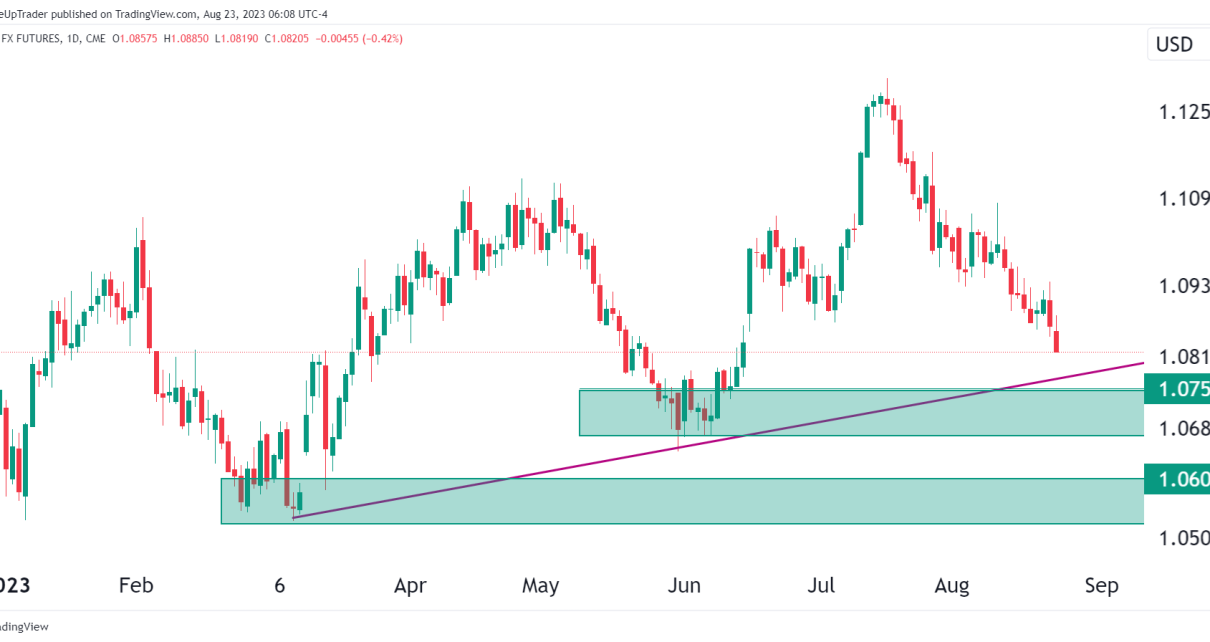
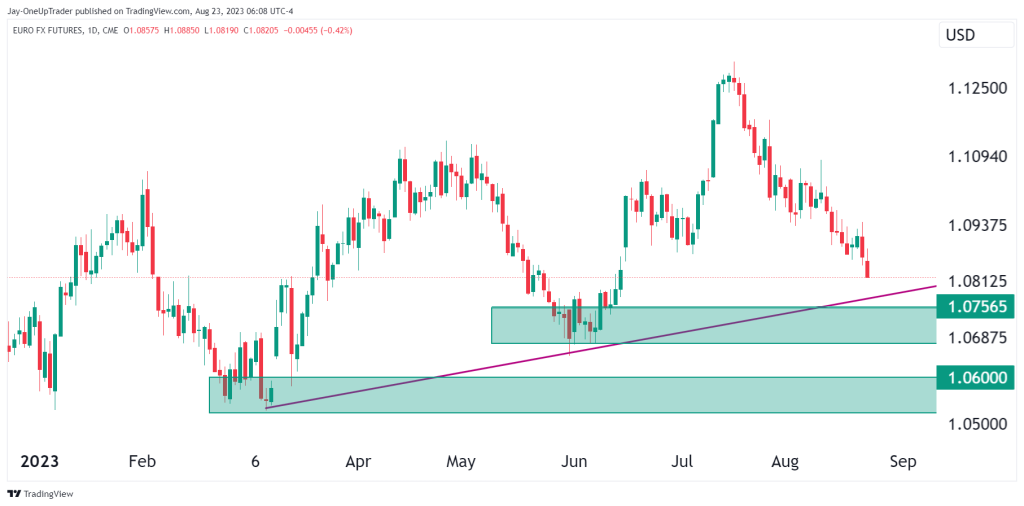
Daily chart
The daily chart shows two minor support levels, one at 1.075 and one at 1.06. If price continues to fall from here due to the Dollar rising, those are the two levels we can watch closely to potentially enter long positions. There is also a minor uptrend line which may act as support. Ultimately we are in the Feds hands now as we await their press conference on the 25th. The RSI is dropping toward oversold territory at the moment.
