


Introduction
Dow Jones E-mini futures continue to grind higher, pressing back toward recent highs near 50,000. Unlike the more volatile NASDAQ, the Dow’s rally has been steadier, a trend followers dream.
However, momentum is no longer expanding aggressively. The market is advancing but doing so in a more controlled, mature fashion. Each time the 50 ma is tested, price bounces giving high probability entries for all traders.
Market Summary
Primary trend: Strongly bullish (daily & weekly)
Current market condition: Controlled uptrend / higher highs & higher lows
Key support (line in the sand): 49,000–49,100 (50-day MA zone)
Bias-defining resistance: 50,000–50,500
Risk: Sustained close below the 50-day MA
Market Structure & Trend
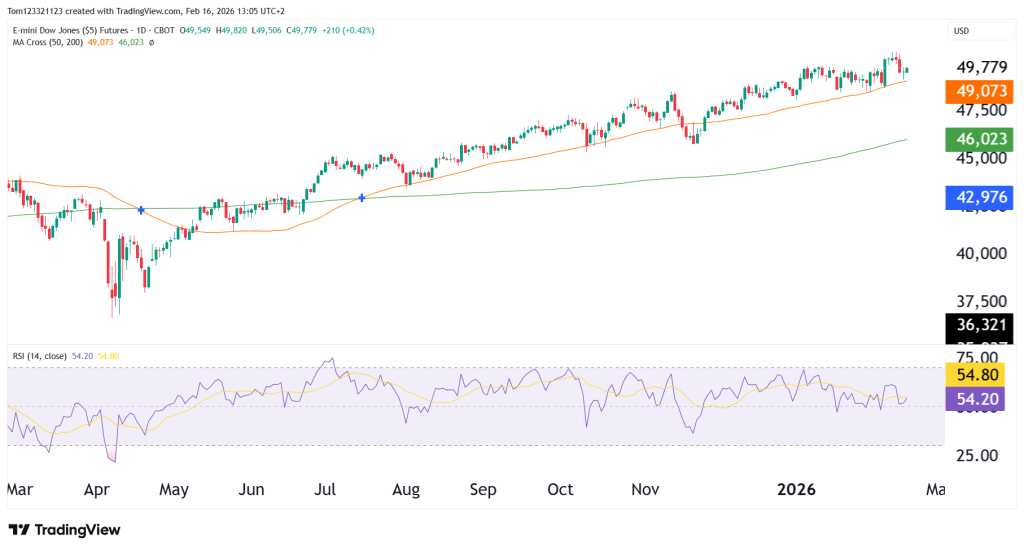
Daily Chart
Key observations:
- Price remains above the rising 50-day moving average (~49,073)
- Higher lows continue to form
- Pullbacks are shallow and quickly bought
- RSI holding around 54–55 (neutral-bullish zone)
In strong uptrends, RSI typically:
- Pulls back toward 40–45 on dips
- Holds above 50 during consolidation
The 50-day MA is acting as dynamic support, and price continues respecting that structure.
Weekly Chart
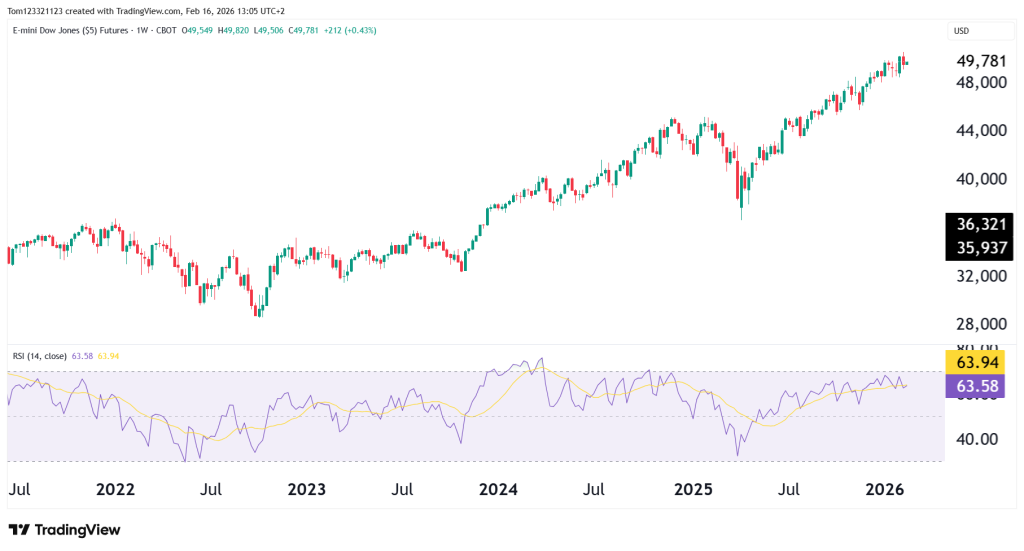
The weekly timeframe shows:
- Clear long-term uptrend
- Price well above the 200-week average
- RSI near 63–64 (healthy bullish momentum)
Importantly, there is no major weekly divergence forming yet. The structure still supports continuation rather than reversal. The price is overextended, though, and there might be some profit-taking in the near term, especially if a catalyst in the news occurs.
The Dow has shown relative strength compared to tech-heavy indices, likely reflecting:
- Rotation into value and cyclicals
- Stabilizing yields
- Stronger economic tone
What Could Be Supporting the Dow
1. Rate Stability
The Dow tends to outperform when rates stabilize rather than fall aggressively. Financials and industrials benefit from:
- Steady growth expectations
- Less valuation compression than high-multiple tech
If Treasury yields are holding firm but not spiking, this supports Dow components.
2. Cyclical Rotation
Capital rotating out of stretched tech names and into:
- Industrials
- Financials
- Energy
- Consumer cyclicals
This environment often favors the Dow over the NASDAQ.
3. Economic Data Resilience
Stronger-than-expected:
- Employment data
- Manufacturing readings
- GDP revisions
Can reinforce the cyclical trade and support Dow futures.
Key Technical Levels
Immediate Resistance
50,000–50,500
Psychological and structural resistance.
A clean break and weekly close above 50,500 would open extension toward 51,500+.
Line in the Sand
49,000–49,100
Confluence of:
- 50-day moving average
- Prior short-term consolidation
Holding this zone keeps the trend clean.
Deeper Support
46,000–46,500
Near the 200-day MA (~46,023).
A move toward this level would signal a larger corrective phase.
Looking Forward: Scenarios
Bullish Continuation (50%)
Price consolidates above 49,000 and breaks 50,500, extending trend higher.
Sideways Consolidation (30%)
Range develops between 49,000 and 50,500 while momentum resets.
Deeper Pullback (20%)
Loss of 49,000 opens downside toward 47,500–46,500.
Final Takeaway
The Dow remains in a solid uptrend, which pulls back to the 50-day MA, offering opportunities to buy.
Unlike tech-heavy indices showing distribution patterns, YM continues to respect trend support and maintain steady momentum.
As long as price holds above the 50-day average, dips remain corrective rather than bearish.
The real risk would emerge only if:
- 49,000 breaks decisively
- Weekly momentum rolls over
- Or macro conditions shift toward tightening liquidity
This analysis is for educational and informational purposes only and does not constitute trading advice or a recommendation to buy or sell any futures contracts. Futures trading involves significant risk and may not be suitable for all investors. Always conduct your own research and consult with a licensed financial professional before making trading decisions.