


Introduction
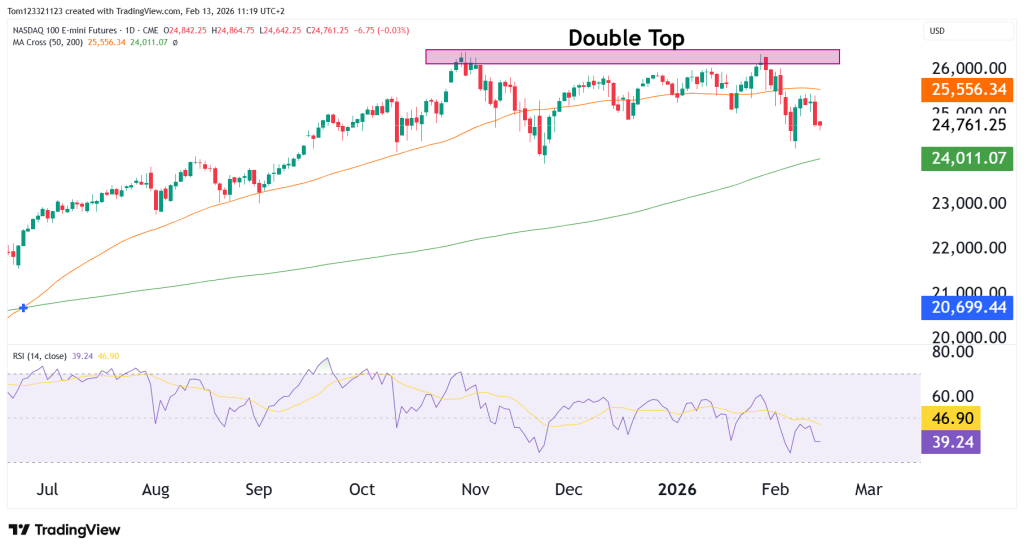
NASDAQ 100 E-mini futures are showing signs of exhaustion after forming a double top structure near the 26,000 area.
Price has now rolled over from that resistance zone and is slipping back below the 50-day moving average. Momentum has weakened noticeably, and the trend is no longer higher highs and higher lows but a sideways consolidation.
The question now is whether this is just another shallow dip in a strong bull market or the early stages of a deeper correction in tech-heavy equities.
Market Summary
Primary trend: Bullish on higher timeframes
Current market perspective: Short-term corrective phase
Key resistance (double top zone): 25,900–26,100
Bias-defining support: 24,600–24,700
What Could Be Driving the Weakness
1. Interest Rate & Fed Expectations
The NASDAQ is the most rate-sensitive major equity index. Any shift higher in Treasury yields or a reduction in expected rate cuts tends to pressure growth names.
Recent firm inflation prints (CPI/PPI surprises or stickier services inflation) can:
- Push yields higher
- Delay expected Fed easing
- Compress tech valuations
2. Treasury Yield Stabilization
If 10-year yields stop falling — or begin drifting higher — high-multiple stocks often reprice quickly. A stabilization in real yields can trigger de-risking in speculative tech positioning.
This aligns with the recent hesitation near all-time highs.
3. Mega-Cap Earnings Rotation
NASDAQ performance is heavily concentrated in mega-cap tech. After strong earnings rallies earlier in the cycle, markets often:
- Take profits
- Rotate into cyclicals or value
- Consolidate leadership
If upside earnings surprises slow while expectations remain elevated, the index can stall even without broad economic weakness.
4. Positioning & Overcrowding
The tech trade has been crowded:
- Long AI themes
- Long semiconductors
- Long mega-cap growth
When positioning becomes extended, pullbacks tend to be sharp rather than gradual. The speed of the recent drop suggests some fast-money de-risking.
Market Structure & Trend
Daily Chart

The chart shows:
- Clear resistance at 25,900–26,100
- Two failed attempts to break higher
- Price slipping below the 50-day moving average
- RSI breaking below 40
During healthy uptrends, RSI tends to hold above 40–45 on pullbacks. A sustained move below 40 signals that bullish momentum is no longer dominant.
Bigger Picture
On the higher timeframe, NQ remains in a broader uptrend.
However:
- Momentum has flattened
- Higher highs are no longer expanding
- Volatility is increasing
This is often how intermediate pullbacks begin.
Key Technical Levels
Double Top Resistance
25,900–26,100
Reclaiming this zone invalidates the bearish structure and resumes trend continuation.
Support
24,600–24,700
This area acts as short-term structural support.
A decisive break below opens downside toward:
- 24,000 (psychological level)
- 23,800–24,000 (200-day MA zone)
Major Trend Support
Around 24,000
If price tests this zone, the reaction will determine whether this is:
- A healthy correction
or - The beginning of trend deterioration
Looking Forward: Scenarios
Controlled Pullback (40%)
NQ finds support near 24,600–24,000 and resumes higher once rates stabilize.
Deeper Correction (35%)
Break below 24,600 accelerates toward 23,800–24,000 as positioning unwinds.
Bullish Reclaim (25%)
Strong macro catalyst pushes NQ back above 26,000, negating the double top.
This analysis is for educational and informational purposes only and does not constitute trading advice or a recommendation to buy or sell any futures contracts. Futures trading involves significant risk and may not be suitable for all investors. Always conduct your own research and consult with a licensed financial professional before making trading decisions.

