


Introduction
The Russell 2000 Futures (RTY) extended their rebound, now up 9% and continuing the strong recovery from last week’s lows. Small caps have shown improving momentum after breaking back above the 50-day moving average, with buyers now attempting to reclaim lost ground ahead of the December macro calendar and year-end positioning.
Let’s review what the technicals are telling us.
Technical Overview

RTY Daily Chart Technical Analysis
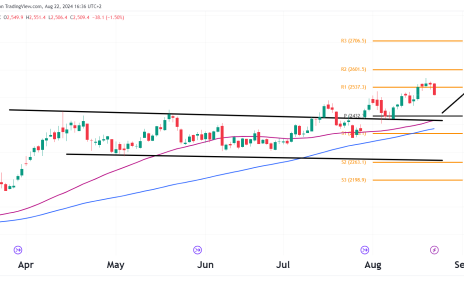
RTY has staged a clean recovery after bottoming near 2,390, which aligns with late-October support. The index has since reclaimed the 50-day moving average at 2,460, a level that previously acted as resistance during the November decline.
Price is approaching the prior ATH region (2,560–2,570)
This area represents the upper boundary of the multi-month range and will act as major resistance. RTY has struggled to sustain momentum above this zone in the past, so a breakout would be a notable bullish shift.
50-day moving average reclaimed
The successful retest and bounce from the 50-day MA (2,460) improves short-term market structure. Staying above it keeps the bias tilted upward.
Meanwhile, the 200-day MA at 2,231 continues to slope upward, showing the broader trend remains constructive.
Momentum improving, but not yet overbought
The RSI has risen to 56.16, suggesting building bullish momentum after being oversold earlier in November. Importantly, RSI is not near the overbought zone, providing room for further upside if buyers maintain control.
Immediate levels to watch:
Resistance
- 2,487–2,500 → Minor supply zone from early November
- 2,560–2,570 → Prior ATH region / major breakout zone
Support
- 2,460 → 50-day MA / immediate support
- 2,415 → Multi-week support shelf
- 2,390 → November swing low
- 2,231 → 200-day MA / long-term trend support
So far, the structure remains intact as long as the index holds above 2,415–2,460.
Probability Table (Next 2–3 Weeks)
| Scenario | Estimated Probability | Notes |
|---|---|---|
| Continuation toward 2,560–2,570 ATH | 50% | Strong rebound, higher lows, momentum encouraging. |
| Consolidation between 2,415–2,500 | 35% | Likely if resistance holds or macro data triggers hesitation. |
| Breakdown below 2,415 → retest 2,390 | 15% | Only likely if sentiment turns risk-off or yields spike. |
Fundamentals
Small caps are still closely tied to interest rate expectations and the overall economy. The Fed’s recent signals about keeping policy steady, along with cooling inflation, have helped support risk appetite. Market participation has broadened, which has lifted small-cap indexes, and a softer U.S. dollar has taken some pressure off risk assets.
Investors are now focused on November payrolls and the CPI report. These releases will help determine whether the Russell 2000 can keep pushing higher or stalls near its all-time high. If the macro data stays supportive, small caps could make a run at new highs. If the data weakens or yields move up, the rally may cool off and turn into a period of consolidation.
Summary
RTY is showing a solid rebound as buyers lift the index back above the 50-day moving average and toward resistance around 2,500. Momentum has picked up, and the trend stays healthy as long as RTY holds above the 2,415 to 2,460 area.
The real test is whether the index can push into the 2,560 to 2,570 all-time high zone. A clean move through that range would signal a fresh bullish leg. If it fails there, the index will likely drift sideways for a bit.
This analysis is for educational and informational purposes only and does not constitute trading advice or a recommendation to buy or sell any futures contracts. Futures trading involves significant risk and may not be suitable for all investors. Always conduct your own research and consult with a licensed financial professional before making trading decisions.