


Introduction
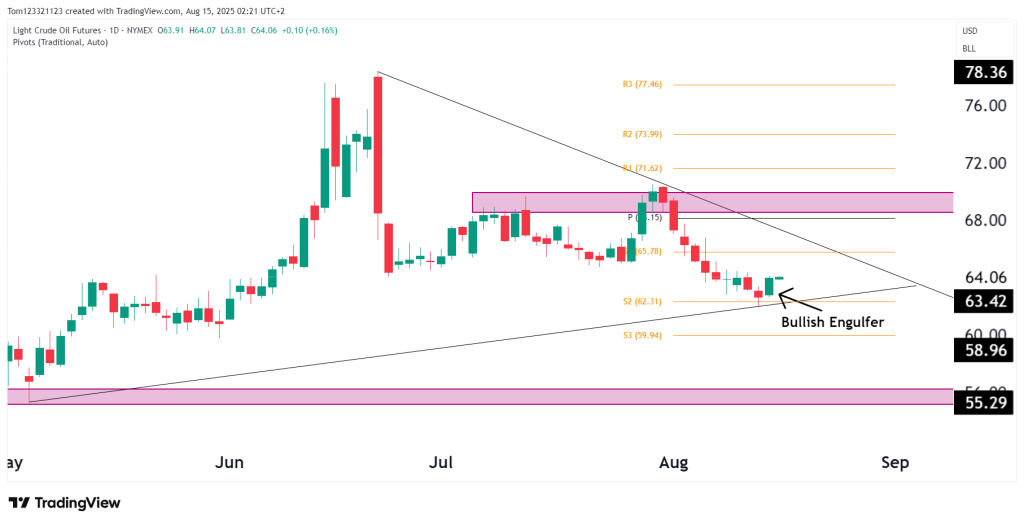
Crude oil is down 4% for the month and 10% for the year, and the technicals for now are signalling to sell. Price has bounced off the S2 level at 62.31 with a bullish engulfing, which bulls are hopeful for prices to move higher.
Technical analysis
The resistance at $68 is the first major level that bulls will target after the S1 level at $65.78. There is a downward-sloping trend line connecting the peak from the end of June to the peak at the end of August. This peak coincides with the same resistance level.
Bullish Case:
Price bounced off the $62.31 S2 level with a bullish engulfing candlestick pattern. Bulls have the RSI momentum on their side in the short term and are now at 43. Their possible targets are $65.78 (S2 pivot) and the Pivot at $68. They will need to keep an eye out for a reversal pattern after the bullish engulfing pattern.
Bearish Case: The price has been trending down for 8 out of 12 sessions since the 31st of July. If it’s a rolling-over formation, then bears could target 59.94 (the S3 level). If that target is reached, it could even be possible to reach the lows of $55.55.
Risk Management Note
Risk management is important in trading and investing, and it is important to approach it with clarity. Each trader must know what type of risk suits them and what does not; there is no strict rule to follow here because it comes down to the investigation of the individual. If a strict plan for risk management is not followed, it could be disastrous because traders then get stuck in the battle of emotions, which fear and greed lead them in a downward spiral and panic.
Someone who keeps their risk management plan up to date and looks to improve it is someone who knows how to approach the markets correctly.
