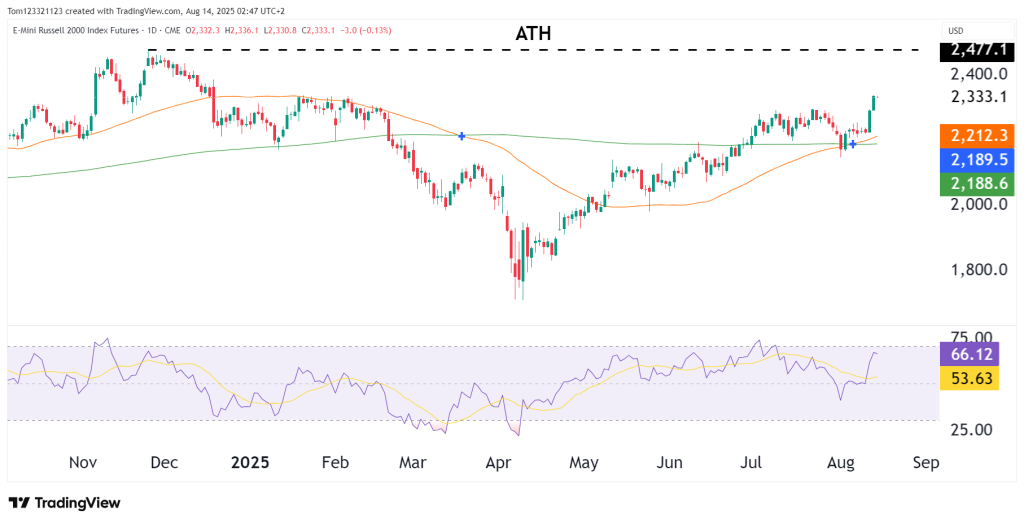
The Russell 2000 futures have surged in the past two trading sessions, up 5% marking its best two days since the 5th of November 2025. This was on the back of a positive CPI report that showed inflation is in line with expectations. The price broke decisively above the 50-day and 200-day moving averages after a prolonged sideways range. This is a very bullish sign for the index.
The breakout rally over the past week has been sharp, leaving price extended in the short term.
The next major resistance lies at the all-time high zone around 2,477, meaning there’s still room to the upside before a key decision point.
The Russell’s relative strength vs. other U.S. indices means that there is small-cap participation in the broader rally.
Momentum & Indicators
RSI at 66.12 is nearing overbought but not yet flashing an extreme warning.
The rally has been fast, so a minor pullback toward 2,300 would be healthy before another leg higher.
Introduction Gold futures (GC) ran sharply higher into early February, pushing past their old all-time highs and into new territory. That move was followed by a fast and noticeable pullback. While the drop looked dramatic, it came after a long, almost straight-up rally that left prices stretched far above their usual levels. The pullback doesn’t Read More…
Technical Analysis Bullish Structure Intact The Euro surged from below 1.08 in Q1 to above 1.16 in mid-April, breaking through several key resistance levels. The most recent pullback appears to have: Resistance and Key Levels The key technical battlegrounds now are: A daily close above 1.1300 would shift momentum strongly back in the bulls’ favor Read More…
A 5% swing was recorded in yesterday’s trading session Hammer or a Hanging Man Candlestick Pattern formation Crude oil’s downtrend still intact since the middle of June Targets for the bears and the bulls Daily Chart Candlestick Yesterday’s session saw a swing in CL from being down 4.3% to reversing and closing 0.6% in the Read More…