- Bulls are in full control as ES rallies on all time frames.
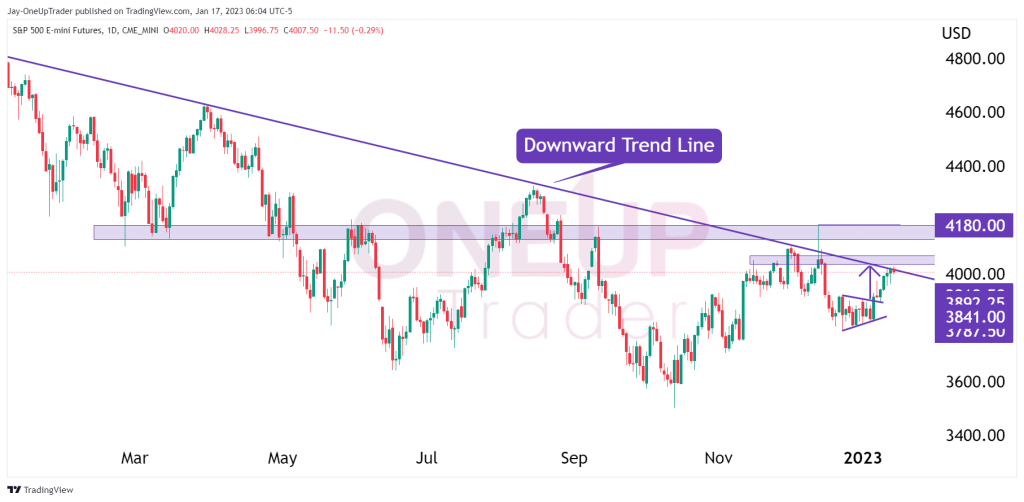
- Price hovers around the year-long trend line.
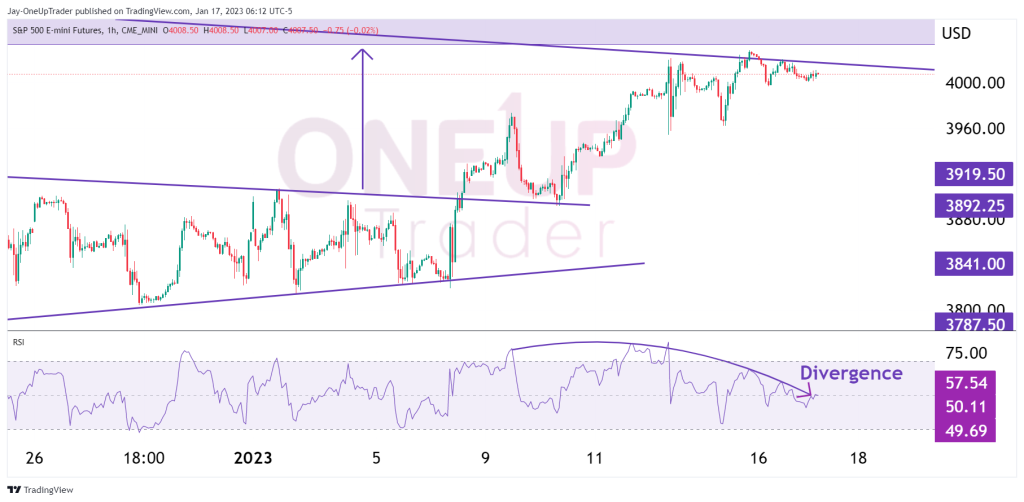
- Divergence spotted on the hourly chart.
Last Weeks Analysis Spot On
Last week we analyzed the potential for a bullish breakout of a small consolidating pattern and set targets at $4,000. ES ended up breaking out with strength and moved right toward that target and is currently trading at $4,010.
Where To From Here?
Looking at price action for the past two weeks, the momentum is bullish regarding the E-mini S&P 500 futures. The market is currently trading at the year-long trend line we have covered many times in these articles. I zoomed out of the image below to give you a full view of the line. It has six connection points now. I suspect a decent amount of selling pressure around these levels as bulls take profit.
It is a risky trade to short from here because the momentum has shifted rapidly even though the risk-reward ratio would be so favorable. It may be the time to sit on our hands and wait it out. Traders and investors will be awaiting the Fed meeting on the 31st of January with the expectation that they will begin slowing down on interest rate policy. I do not suspect Powell will become hawkish. However, he will need to accept that their aggressive approach is working as intended, and the market will like that.
Hourly Chart Showing Signs Of Divergence
Once again, it’s important to emphasize that divergence does not immediately mean a reversal in price, as we have seen on the hourly chart with the current sideways movement. In fact, the longer the price moves sideways during bearish divergence, the better it is for bulls.