Introduction
It has been about 4 months of consolidation in US equities if looking at the weekly or daily chart. Now it looks like NQ is starting to break out. The volume is high, resistance has been broken, and the price is starting to settle into a trend instead of being stuck in a range.
The bulls are pushing for all-time highs, and currently, we are only 3.8% away. So, is it time to buy or is this another dead cat bounce?
Technical Analysis
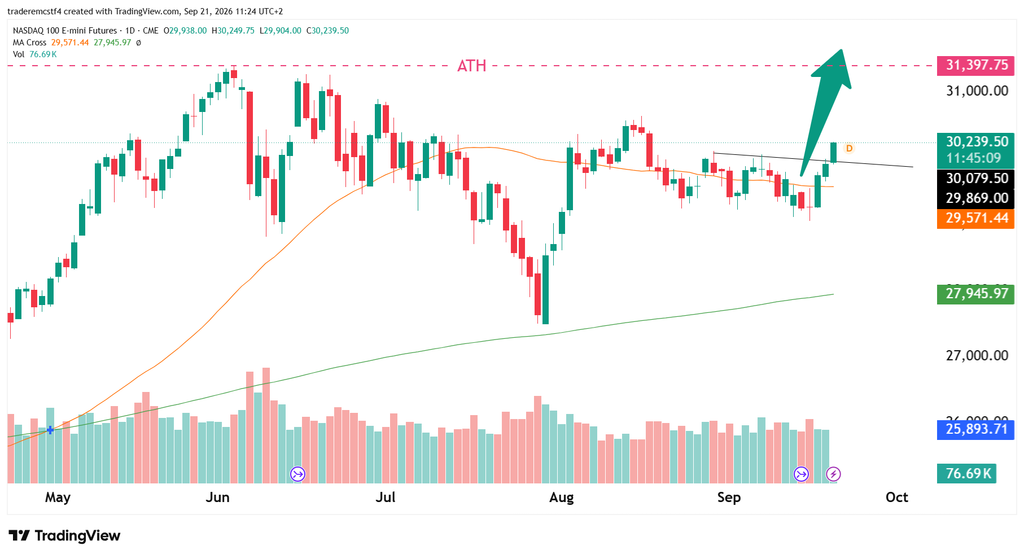
On the daily chart above, we can see that the price is not above the 50-day moving average after sitting on and testing since the start of August. The volume is also strong which is adding to the bullish case.
The all-time high of 31,397.75 is in plain sight now as long as we see a continuation after today’s close (21 September).
Start Your Evaluation Now!
Weekly Chart
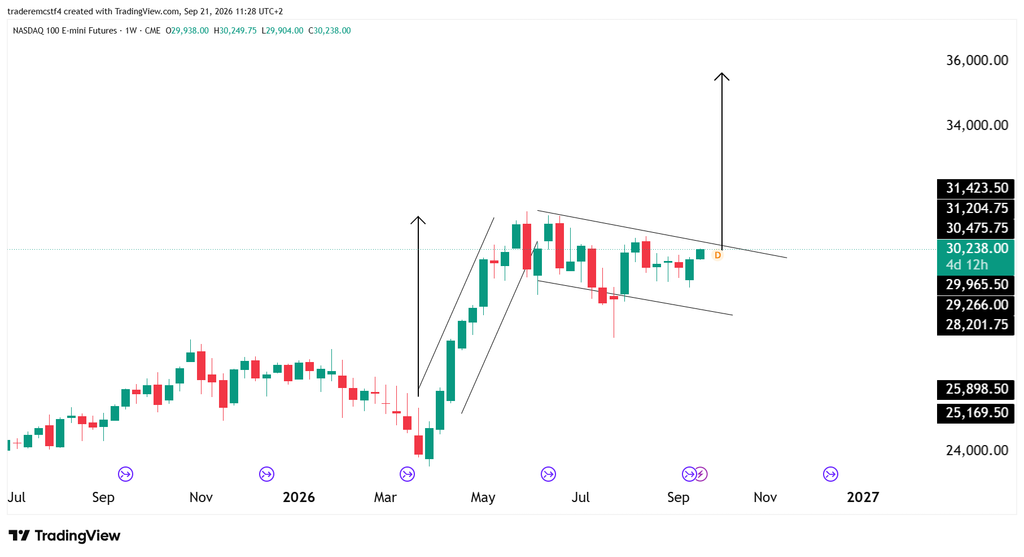
The weekly chart is showing a bullish flag pattern so in the short term the first target is to break above 30,640 which is the high from Monday August 17th. If we do see a clear break above that level, there is very little case for the bears and the bull case gets very strong.
Trade Ideas
- Long: After a confirmed break and successful retest of 30,640, consider entry near 30,660, stop 30,500, targets 31,000 and 31,390.
- Short: If a breakout fails and 30,640 rejects a retest from below, consider entry near 30,600, stop 30,750, target 30,300.
This analysis is for educational and informational purposes only and does not constitute trading advice or a recommendation to buy or sell any futures contracts. Futures trading involves significant risk and may not be suitable for all investors. Always conduct your own research and consult with a licensed financial professional before making trading decisions.