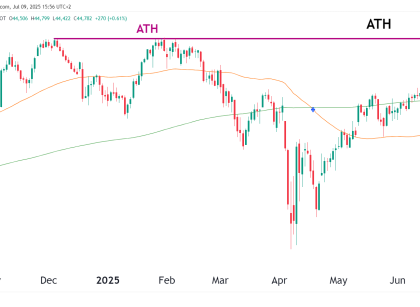
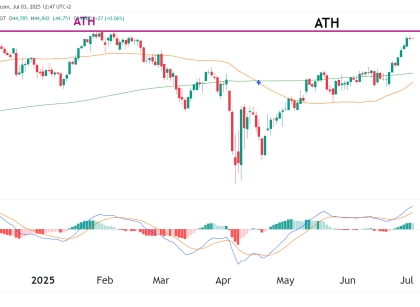
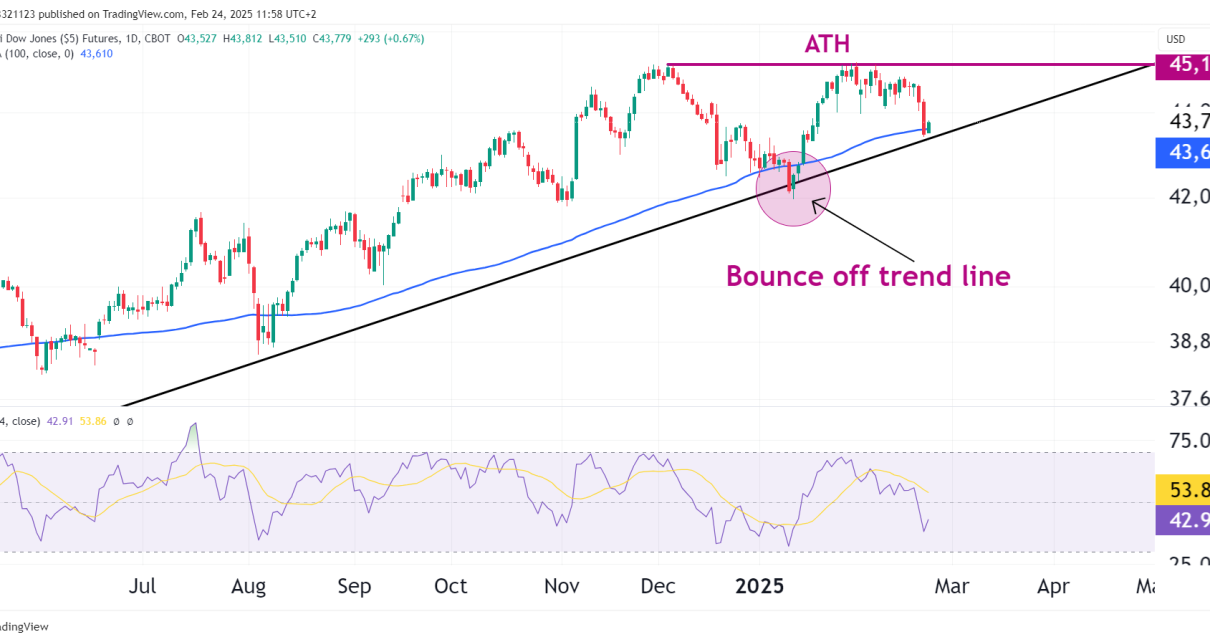
Technical Analysis

Bullish opportunities as Dow Jones Futures (YM) bounce inside support zone

The anchored vwap, stochastic, and tight price range give us a bullish trade. How we can take the trade and the length of time, we expect for it to play out. Trader mindset announcement. Technical Analysis Anchored VWAP: The anchored vwap anchors the volume-weighted average price to a specific candle on the chart. In the example Read More…

Technical Analysis

Dow Jones futures (YM) rally ahead of CPI report

Inflation report later today will likely dictate price action for the remainder of the week. Analyzing how the triangle pattern is providing three possible setups. The triangle pattern Last week we analyzed the triangle pattern that is forming on YM. Take a look at it here. The price is currently trading right at the top of Read More…

Technical Analysis

Dow Jones futures coiling up for a bullish break out

Pole & Triangle formation showing a strong potential rally is on the cards. Gaussian channel providing long entries on pullbacks for bulls. Macd confirms a period of consolidation. Technical Indicators Pole & Triangle: There was a strong rally before the triangle started forming. During this period of consolidation (Triangle), price has moved sideways, and this Read More…

Technical Analysis

How the Dow Jones Futures (YM) have diverged from the rest of the market

Breaking down how the dow jones diverged from other market indices last year. Analyzing the symmetrical triangle formation on the daily time frame. A true story about a trader who turned $5,000 into $15,000,000 in seven years. Quick Breakdown The Dow has been trading sideways for the majority of this year, remaining unchanged so far. Read More…

Market Overview Technical Analysis Trading Tips

Dow Jones Futures (YM) Now Only 6% From All-Time Highs

The Dow Jones continues to diverge from the rest of the market Bearish divergence has been spotted on the daily chart Bull and Bear targets YM Continues To Rally The Dow continues to diverge from the rest of the market as it is now only 6% away from all-time highs. YM is up 10% in Read More…

Market Overview Technical Analysis

Technical Outlook: Dow Jones (YM) Futures Prices Continue to Rally

A closer look into the Parabolic channels. Consolidation on the hourly chart could break in either direction. Parabolic Channels With parabolic channels, we take the same approach when drawing the main parabola; we need at least 3 points to make the connection. I’ve marked the main parabola in the image below with the connection points. Read More…