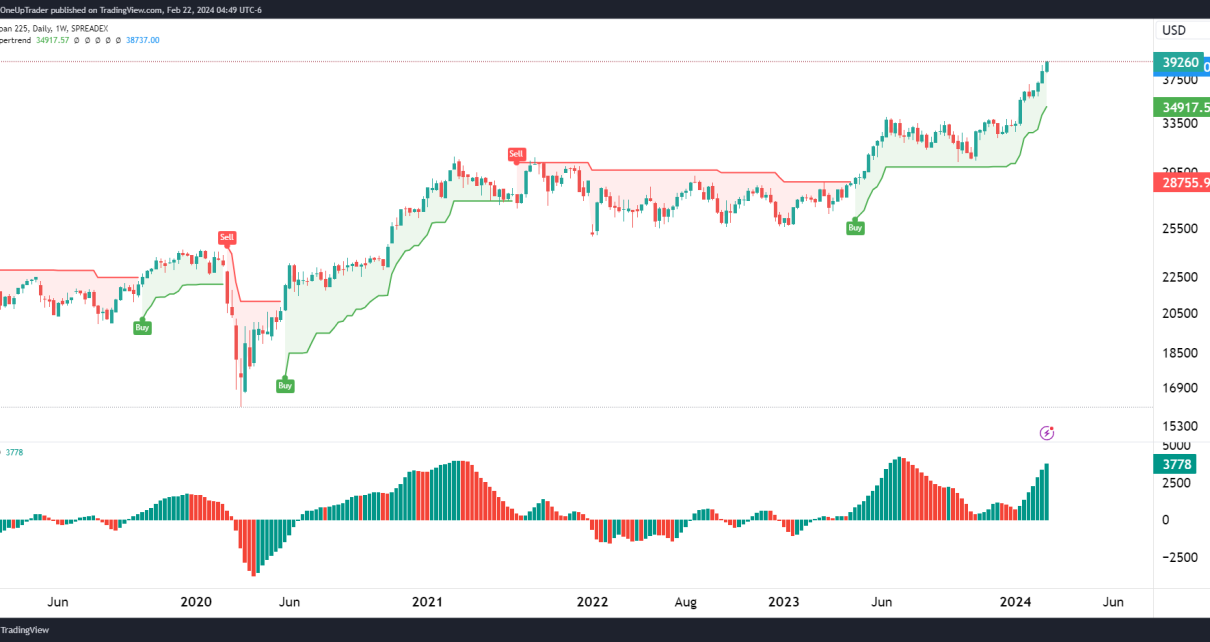
Recap Our GC analysis has been spot-on since the start of these articles, and last week was no different. Today we will take a look at how the trade ideas from last week are coming into play today. Read the previous article here. Technical analysis 100-Day MA: Price is bouncing off the 100-MA on the daily. It Read More…
Tag: stock market
6E Euro FX futures rally, confirming bullish reversal
Bulls take control In the previous analysis I did on 6E, I mentioned the possibility of a bullish reversal. That has now been confirmed with strong bullish price action. The trade was a high-risk, potentially high-reward play, but it is working out at the moment. Take a look at the previous article here and the chart below: Read More…
Equities Surge as US Inflation Eases, Confirming Bets of a Fed Pause
Equities rose on Tuesday amid optimism of a looming Fed pause. The S&P 500 and Nasdaq achieved their highest closing points in 14 months. This was driven by the data release indicating a modest increase in consumer prices in May. As a result, investors are now more confident that the Fed will not lift interest Read More…
Crude Oil futures (CL) refuse to break below $60
Parabolic curve The parabolic curve on the daily chart for CL has been our main focus point for most of the crude oil analysis this year. It stretches back to July of last year and still remains a strong formation. Price is currently sitting at $70 per barrel, and bears are still unable to push Read More…
Equities Soar as Investors Brace for US Inflation Figures and Monetary Policy Meetings
US equities rose on Monday, with the S&P 500 and the Nasdaq reaching their highest closing levels since April 2022. Investors eagerly awaited the week’s inflation data and the Federal Reserve’s interest rate decision. Amazon, Apple, and Tesla contributed to the S&P 500’s recovery of 21% from its October 2022 lows. Some investors believe Wall Read More…
Dow Jones futures (YM) tests horizontal resistance of ascending triangle
Technical analysis Like all other US indices, YM has been surging on the back of strong US data. The Dow Jones is currently testing the horizontal resistance level of an ascending triangle formation on a daily time frame. The question is whether bulls will be strong enough to be able to push price through current Read More…