Equities rose on Monday, with the Nasdaq hitting record highs as market participants looked forward to the upcoming FOMC policy meeting. At the same time, investors absorbed mixed PMI data from the US that showed pockets of weakness and strength in the economy. The Federal Reserve will hold its policy meeting on Wednesday, and markets Read More…

Tag: stock market
NASDAQ 100 E-mini Futures Daily Technical Analysis
Chart OverviewThe Nasdaq 100 E-mini Futures are showing signs of exhaustion at current levels, as the price action is forming a rising wedge pattern—a bearish signal when it appears at the top of a rally. With the price sitting near 21,800, the market appears stretched. Let’s break down what this could mean for traders and Read More…
Gold Futures (GC) Technical Analysis – December 11, 2024
Building on the November 25 analysis, where we saw a potential Head and Shoulders (H&S) forming, the updated chart tells a different story. The $2,542.3 “Last Support” held firm, and price action has invalidated the H&S pattern, leading to a false alarm on the formation. The bullish momentum has pushed prices back toward $2,707.6, so Read More…
Equities Slide as Tech Giants Nvidia and AMD Weigh on Sentiment
Equities fell on Monday, led by a decline in tech stocks like Nvidia and Advanced Micro Devices. Meanwhile, market participants were cautious as they eagerly awaited the US consumer inflation report for more clues on the outlook for US monetary policy. Nvidia fell 2.5% after reports that China was investigating the company for violating antimonopoly Read More…
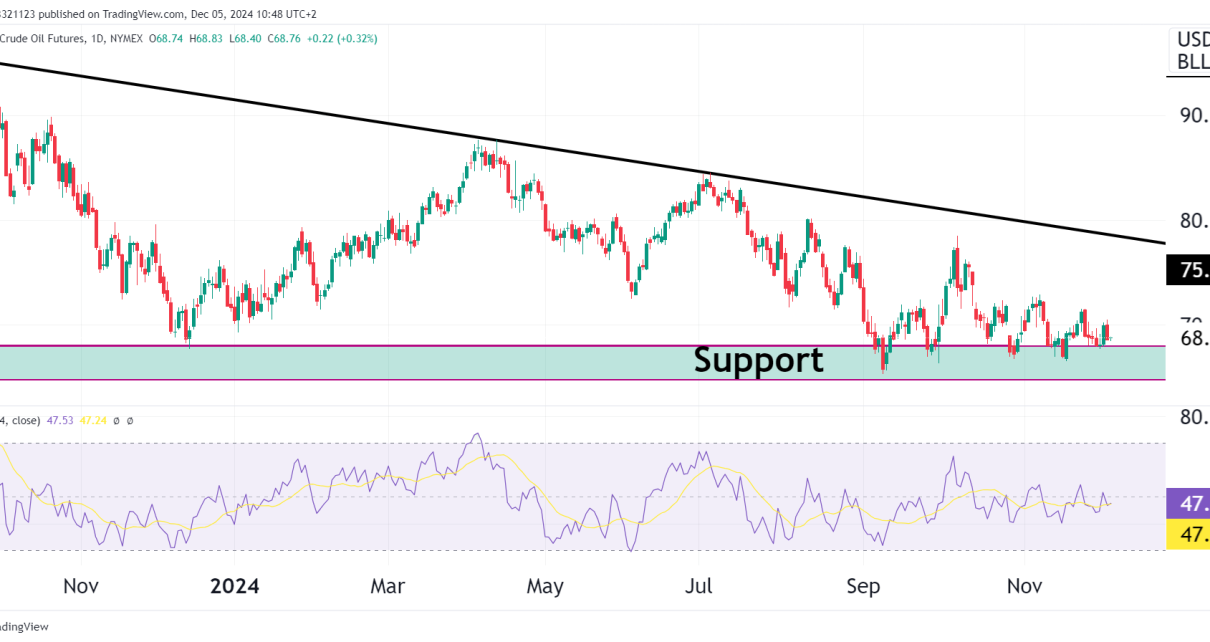
Crude Oil Futures Technical Analysis – December 5, 2024
Chart OverviewCrude Oil prices are still sitting in the yearly support zone around $67-$69. The market is watching closely for a breakout above $75.30, which aligns with the descending trendline resistance. Adding bullish momentum is the recent news of U.S. crude oil stockpiles falling more than expected, sparking hopes for tighter supply and higher prices. Read More…
U.S. Dollar Index (DXY) Technical Analysis – December 4, 2024
Chart OverviewThe U.S. Dollar continues its bullish trajectory due to optimism surrounding Donald Trump’s presidency and expectations for a pro-growth economic agenda. The DXY has successfully broken above its long-term descending trendline, with the price now consolidating just above 106.6, a key resistance-turned-support zone. This move puts the all-time high (ATH) at 114.789 firmly in Read More…