Chart Overview
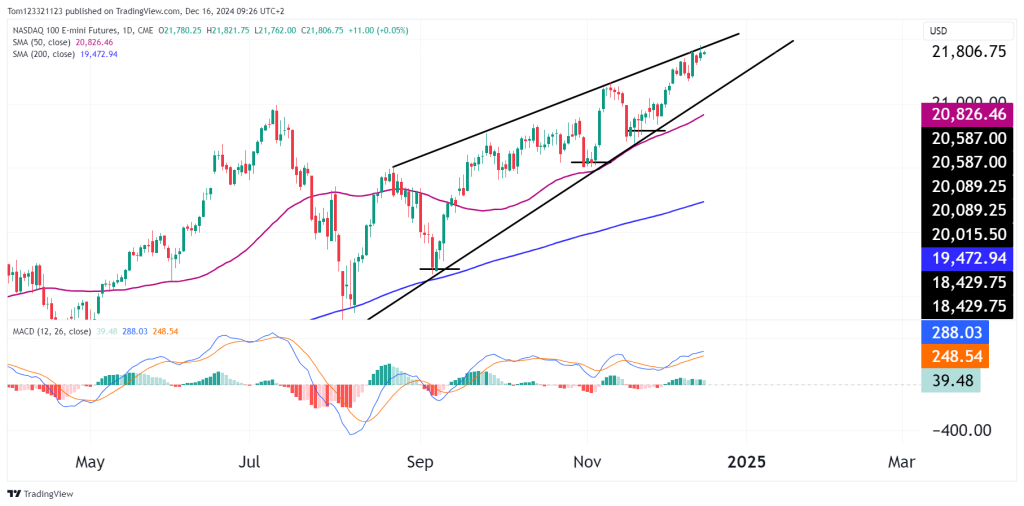
The Nasdaq 100 E-mini Futures are showing signs of exhaustion at current levels, as the price action is forming a rising wedge pattern—a bearish signal when it appears at the top of a rally. With the price sitting near 21,800, the market appears stretched. Let’s break down what this could mean for traders and identify high-probability trade setups.
Key Technical Observations
Rising Wedge Formation
- A classic rising wedge is taking shape, with higher highs and higher lows converging toward a tightening apex.
- Rising wedges typically resolve bearishly, as the loss of momentum and shrinking price range signals a potential reversal.
- A breakdown below the lower trendline (~21,500) would confirm the wedge pattern and open the door for a pullback toward key support levels.
MACD Momentum Shows Caution
- The MACD histogram is flattening, suggesting fading bullish momentum.
- While the MACD line remains above the signal line, a crossover to the downside could indicate a stronger retracement is underway.
Overbought Conditions
- The market has rallied significantly since November, and the 50-day SMA at 20,826 remains far below current levels.
- A retracement toward this level would not break the broader uptrend but would reset momentum for the next potential leg higher.
Potential Trade Scenarios
Bearish Setup – Rising Wedge Breakdown ⚠️
- Entry: Short below the rising wedge support (~21,500).
- Target 1: 20,826 (50-day SMA), acting as the first major support.
- Target 2: 19,472 (200-day SMA), a stronger downside target if selling accelerates.
- Stop-Loss: Above 21,800 to manage risk in case the wedge fails to break.
Bullish Setup – Breakout Above Resistance 📈
- While the wedge is a bearish pattern, a breakout above the upper resistance trendline (~21,900) would invalidate it.
- Entry: Long above 21,900 on strong volume.
- Target: 22,500, as bulls could extend the rally into new highs.
- Stop-Loss: Below 21,500 to minimize downside exposure.
Key Support and Resistance Levels
- Resistance:
- Rising wedge resistance: 21,900
- Psychological target: 22,000
- Support:
- Rising wedge support: 21,500
- 50-day SMA: 20,826
- 200-day SMA: 19,472
Outlook & Summary
- Short-term (1-2 weeks): A break of the rising wedge pattern is possible, with a pullback toward the 50-day SMA at 20,826.
- Medium-term (1-3 months): If bulls defend the 50-day SMA, the uptrend can resume, targeting fresh highs near 22,500.
- Long-term (3+ months): The broader uptrend remains intact unless price breaks below the 200-day SMA at 19,472.
Final Takeaway
The Nasdaq 100 is showing signs of overextension, with a rising wedge signaling a possible retracement. Traders should watch for a break below 21,500 for bearish confirmation or a breakout above 21,900 for continuation of the uptrend. A pullback to 20,826 would provide a healthy reset, presenting a high-probability-long opportunity for bulls.