

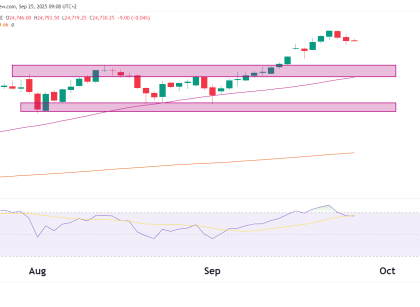

Price: 6,455.00Day Change: +0.92%RSI (14): 73.77 (Overbought)50-day MA: 6,157.29200-day MA: 5,929.73 Price Structure Update Since the previous analysis, the S&P 500 futures have continued with the grinding uptrend since breaking the previous ATH back in June. Technical Overview Feature Comment Trend Strong bullish trend, clean extension from 50/200 MA Momentum RSI above 70 is strong, Read More…
Tag: futures trading
Get Funded Faster This Summer – Trading Days Reduced To 7
Introduction We’re speeding up your path to funding! From now through August 31, the minimum number of trading days to complete your evaluation has been reduced from 10 to 7. Traders can take advantage of this offer as it applies to all account sizes. In October of 2024, we reduced the trading days from 15 Read More…
Gold Crawls Higher as Market Awaits Fed Outlook
Gold prices held steady on Wednesday as market participants looked forward to the FOMC policy meeting. At the same time, a weaker dollar after poor employment figures lent support. However, gold has lost some of its safe-haven appeal due to recent trade deals, which have eased global trade war concerns. The Federal Reserve will conclude Read More…
Crude Oil (CL) Technical Analysis 30 July 2025
Date: July 30, 2025Current Price: $69.21Change (D/D): 0.00%RSI (14): 59.40 (neutral-bullish)Key Levels: Price Structure & Momentum Update In our last breakdown, we noted that Crude Oil was stuck in a tightening coil within a shaded consolidation band between $65 and $68. As expected, a breakout attempt has now occurred: This is the first proper break Read More…
US Equities: Earnings Resilience Clashes with Policy Uncertainty
The US equities approach a vital week, facing a conflict of good corporate earnings on one end and tightening macroeconomic factors on the other. The S&P 500 and Nasdaq 100 are holding close to all-time highs, thanks to a bullish earnings season, sentiment around AI, and hope that the economy will achieve a soft landing. Read More…
Dollar (DXY) Technical Analysis July 29
Current Price: 98.653Daily Change: −0.011 (−0.01%)Key Resistance: ~101.975 (horizontal)50-day MA: 98.289 (currently being tested)200-day MA: 103.363RSI (14): 57.44 (neutral-bullish) Technical Structure RSI & Momentum Interpretation This recent push through the 50-day moving average and the uptick in RSI show that short-term sentiment has improved for the U.S. dollar. However, this is happening within a broader Read More…