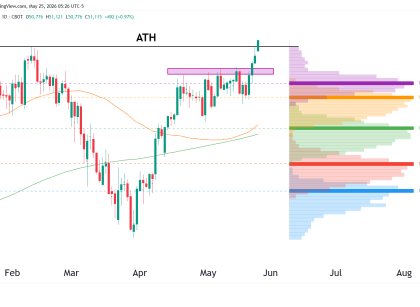
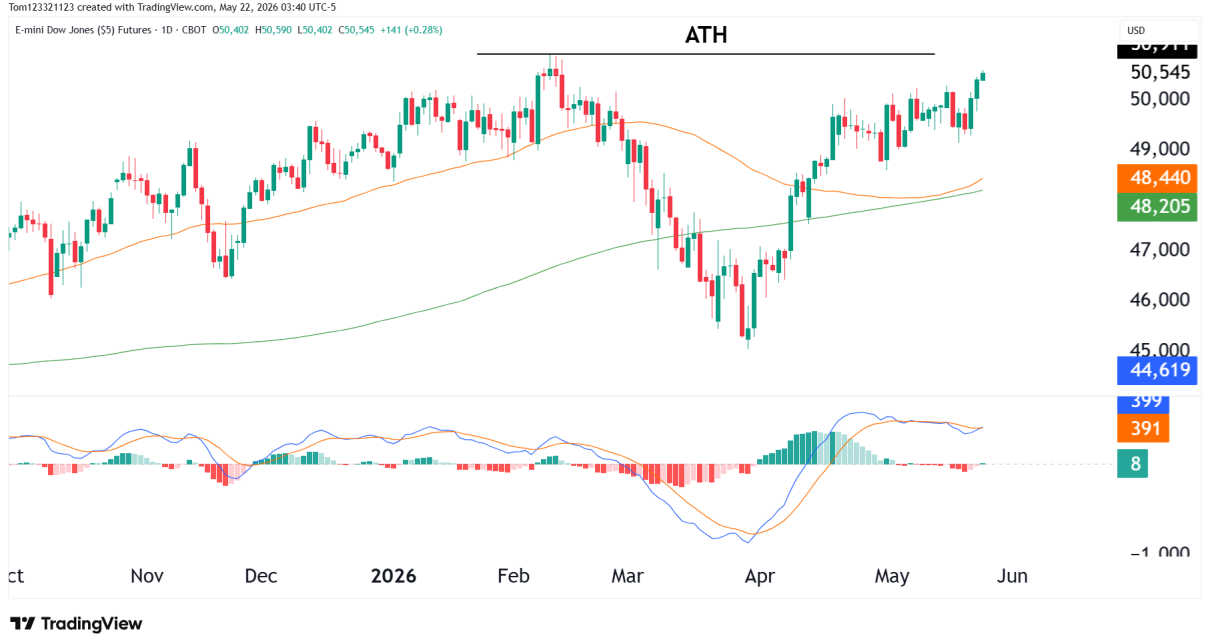
Fundamental Analysis

Gold Rises as Dollar Takes a Dip on Poor Economic Data

Gold prices increased slightly on Tuesday as the dollar weakened, making gold more attractive to foreign buyers. At the same time, investors were awaiting more inflation data from the US and speeches from Fed policymakers. These will give guidance on the outlook for rate cuts in the US. The dollar weakened after poor data from Read More…

Nasdaq 100 index futures (NQ)
Technical Analysis

Technical Analysis for NASDAQ 100 E-mini Futures

Weekly Chart Key Levels to Watch on the Weekly: Daily Chart Key Levels to Watch on the Daily: Potential Trades: It’s essential to monitor these levels and adjust strategies accordingly. The rising wedge and RSI divergence should be watched closely for signs of a potential reversal. Remember to manage risks effectively, as markets can always Read More…

Technical Analysis

Dollar falling again? Technical outlook

Weekly Chart The U.S. Dollar shows a symmetrical triangle pattern, which is typically indicative of a continuation or a reversal pattern depending on the breakout direction. Price is sitting at the top end of the triangle and is also in a multi-year support/resistance zone. Key Levels to Watch on the Weekly: Daily Chart On the Read More…

Fundamental Analysis

Equities Dip as Investors Await Key US Economic Data

Equities closed slightly lower on Monday as markets awaited more economic data from the US for insights on the Fed’s policy outlook. At the same time, there was a bit of caution, as US government agencies could be shut down by Friday. Recently, Nvidia gave a strong forecast that led to a rally in equity Read More…

Fundamental Analysis

Currency Futures Rise as Dollar Rally Takes a Breather

Currency futures strengthened on Friday as the dollar paused its recent rally, ending the week lower. The dollar has been climbing for two months as markets scale back expectations of Fed rate cuts. Initially, investors had expected the first rate cut to occur in March this year. However, US economic data has consistently come in Read More…

Crude Oil Futures
Technical Analysis

Light Crude Oil Futures: Technical Outlook

Weekly Chart AnalysisThe Light Crude Oil Futures on the weekly chart have a clear consolidation pattern within a defined support zone. Volume Profile Visible Range (VPVR) indicates substantial trading activity at these levels. The Relative Vigor Index (RVI) is setting a steady momentum, with the RVI line slightly above its moving average, indicating a slight Read More…