- Microsoft forecasts strong revenue growth.
- Google posts positive results showing the company may survive a recession.
- Investors are expecting the Federal Reserve to raise rates by 75 basis points.
The E-mini Nasdaq 100 (NQ) futures outlook remains bullish on Wednesday in the wake of positive risk sentiment. While investors were on edge ahead of a US Federal Reserve meeting anticipated to result in another significant rate hike, better-than-expected revenue reports of Microsoft and Google helped calm a jittery mood in the stock markets on Wednesday.
After Microsoft predicted strong revenue growth and Alphabet, the parent company of Google, reported strong search engine ad revenues, Nasdaq 100 futures rose 1.5 percent in Asia.
The world’s largest seller of online advertising, Alphabet Inc., came close on Tuesday to meeting Wall Street sales projections. Its shares spiked up, hoping it could surpass smaller online competitors in a recession.
To offset some of the doom caused by Walmart’s earnings warning and weak US economic statistics, Alphabet shares increased by 5% after hours and Microsoft shares by 4%.
At 1800 GMT, the US central bank is anticipated to announce a rate increase of 75 basis points (bps). A 100 bps increase is about 15% more likely than futures suggest. The Treasury market has already priced in that numerous abrupt near-term hikes will be detrimental to longer-term growth.
On Wednesday, the benchmark 10-year Treasury yield remained unchanged at 2.8032 percent, falling short of the two-year yield of 3.0508 percent.
In addition to concerns that interest rates could hurt economies, Europe is experiencing an energy crisis. China is dealing with the COVID-19 regulations and new setbacks to its already troubled real estate market.
E-mini Nasdaq-100 (NQ) futures technical outlook:
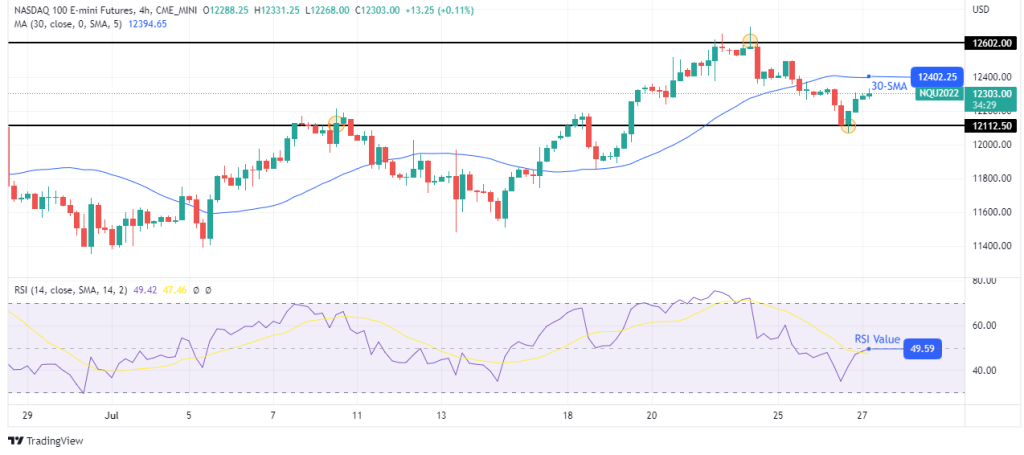
Looking at the 4-hour chart, we see the price pulling back to retest the recently broken 30-SMA. This move comes after the price found support at 12112.50. The RSI is trading slightly below 50, favoring bearish momentum.
If the 30-SMA holds as resistance, we might see the price retesting and possibly breaking below 12112.50. However, if the price breaks above the SMA, we might see a retest of 12602.00, which acted as resistance on July 22. This downtrend will continue if the price stays below the 30-SMA and RSI trades below 50.