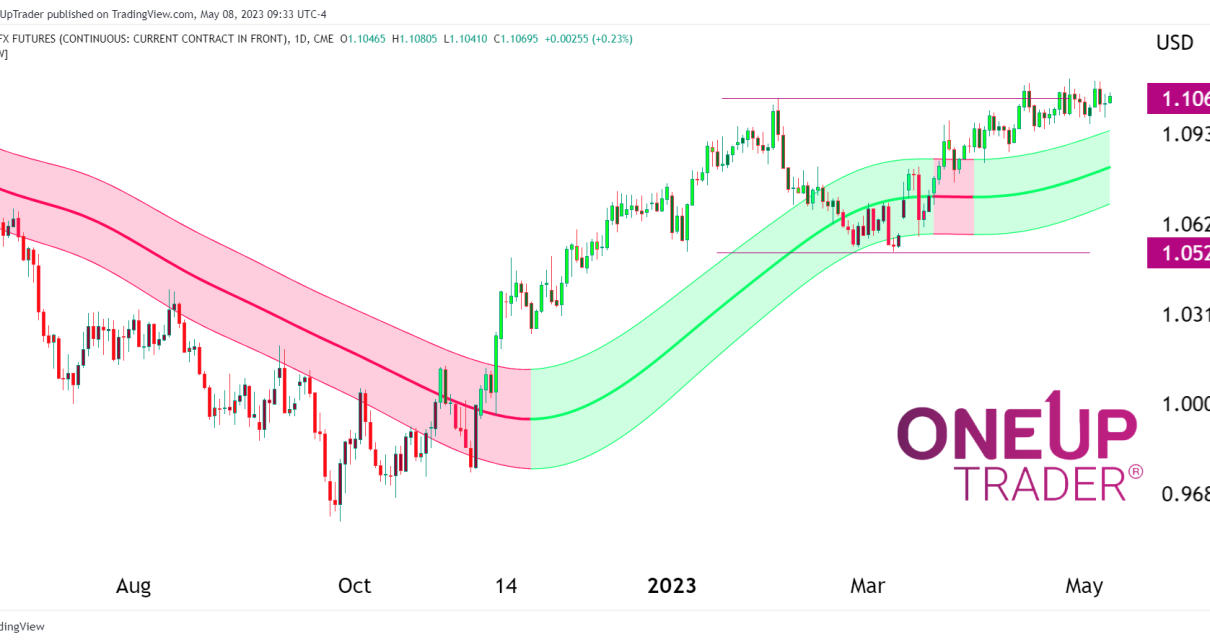
Market Overview Technical Analysis

E-mini Nasdaq Futures (NQ) Crashes After FOMC Statement

NQ prices dropped 8% this week. Bart pattern spotted on 1-Hourly time frame with a high volume spike Bearish market conditions persist. NQ Suffers an 8% Price Drop We saw the Nasdaq suffer an 8% drop this week, going from $11,600 to $10,080. The sell-off began on Monday but was spurred on by the Fed’s Read More…

Market Overview Technical Analysis

Dollar Index Rallies Amid Fed’s Rate Hike

The US Dollar has rallied 18% this year due to an aggressive interest rate policy. Correlation between the Dollar and the Equities Futures markets. Technical Analysis on the US Dollar. Dollar Likely To to Remain Stronger The US Dollar has rallied this year by more than 18% due to the aggressive policy outlined by the Read More…

Market Overview Technical Analysis

Euro (6E) Futures: Technical Outlook Pending Fed Rate Decision

The Fed rate decision and press conference may heighten market volatility. The bullish breach above the trend channel has not significantly changed market sentiment. An analysis of the 1-hourly chart. Fed Day Today is a very big day for the markets as the Fed will announce its rate decision with expectations of a 75 basis Read More…

Market Overview Technical Analysis

Technical Analysis: E-mini S&P 500 (ES) Rallies Off Lows

The weekly chart shows a bullish false-break candlestick formation. Analyzing the support/resistance band on the 4-Hourly chart. A look into the 1-Hourly trend channel. False Break Candle The false break candle strategy is one we are familiar with at OneUp Trader, and for a good reason – its reliability! The pattern works because when the Read More…

crude oil technical analysis
Market Overview Technical Analysis

Parabolic Curve Retest and Inverse Head & Shoulders on Crude Oil (CL) Futures Chart

The parabolic curve on the CL chart continues to act as support. A Potential inverse Head & Shoulders formation on the 4-Hourly time frame. Point of control volume profile acting as resistance. Daily Chart Recap From last week’s multiple tests of the parabolic curve, CL is repeating the same tests once more, with the price Read More…

Market Overview Technical Analysis

Technical Analysis: Gold (GC) Futures

Gold bears are targeting lower prices. Spinning top from yesterday’s session on the Daily chart. Price retraces to test the neckline of a head & shoulders on the 2-Hourly chart. Recap From Earlier This Week On Monday 24th, we looked at the slight bounce in Gold prices out of the minor support potentially forming a Read More…