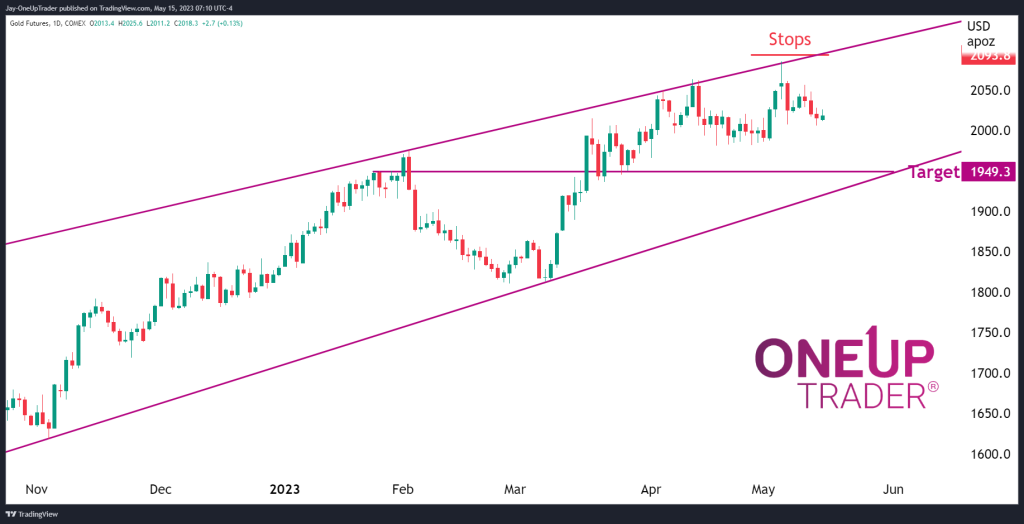
- The short trade from two weeks ago is working nicely.
- What we can do with the position moving forward.
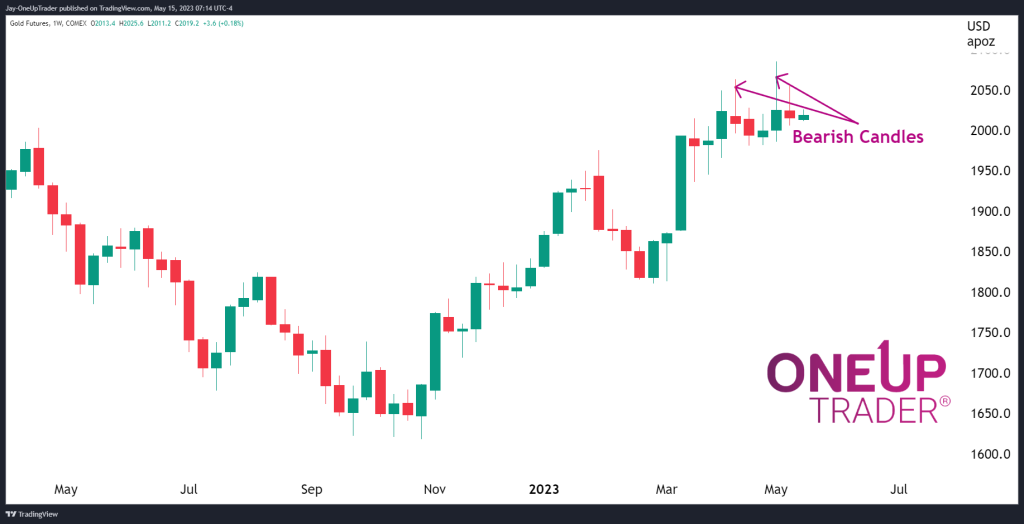
- Weekly candles show bearish wicks.
Recap
Two weeks ago, we looked at the candlestick that formed on the daily chart in GC, which eventually closed as a spinning top at the top of an up trend. It signals to us that there is much confusion in the market when a candlestick like this forms, and this gave us a short opportunity. You can read the article here.
Moving forward
Price action has been bearish recently, and the top of that candlestick will be a difficult one to break for the bulls. At this point, it could be a good idea to take profit slowly while leaving at least 50% of the position open for a potential move even lower. Targets for the move extending lower would be $1,949.3.
Weekly Chart
I want to point something out on the weekly chart, and it’s the fact that there is a lot of sell pressure above the $2,030 level. This is emphasized by the bearish wicks which keep suppressing the price. Traders should factor this into their technical analysis because it tells us that there is a very strong resistance level forming. Bulls could find it very difficult to make new highs this year, by the look of it.