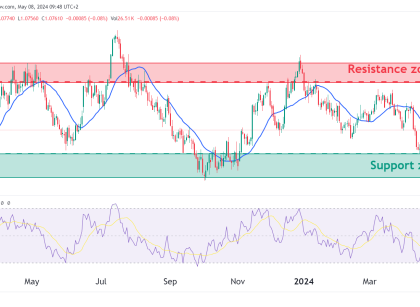
Chart Overview Trendlines and Channel (BULLISH):The chart shows a rising channel pattern. The price is bouncing between the top and bottom lines of the channel, and these lines are clear and strong. Candlestick Analysis (BEARISH):The recent candlesticks are a mix of green and red, and the latest one is a big red candle. This is Read More…
Technical Analysis
NASDAQ (NQ) Key Technical Analysis Trades
NASDAQ Chart Overview In this chart, we’re looking at the NASDAQ 100 E-mini Futures (10-minute intervals) along with the Simple Moving Average (SMA), Relative Strength Index (RSI), and Volume Profile Visible Range (VPVR) indicators. Price Action and Technical Patterns Channel and Breakout Analysis We can see that the price was trading within an ascending channel, Read More…
Technical Analysis: S&P 500 E-mini Futures: Trade Opportunities
Volume Profile: The High Volume Node (HVN) signifies a price level with substantial trading activity, indicating a strong interest from traders. This level usually acts as a magnet for future price action, drawing prices towards it. The Point of Control (POC) gives the price level with the highest trading volume over the period. It is Read More…
Russell 2000 Futures (RTY) Technical Analysis
RTY has refused to break out of its almost two year consolidation even as the bigger indices continue to make new highs. RTY has seriously lagged, is it time for it to catch up and finally break out of the consolidation zone or are we headed right back down? Weekly Chart Bulls need to see Read More…
S&P 500 (ES) Technical Analysis as U.S. Economy Grows 2.4%
The U.S. economy continues to expand in Q1 2024, with a projected 2.4% annualized GDP growth, exceeding the Fed’s non-inflationary growth rate. The IMF has raised its 2024 U.S. growth forecast to 2.7%, citing strong consumer spending and a strong labor market, which added an average of 276,000 jobs per month in Q1. Inflation is Read More…
Key Euro Technical Analysis as Fed and ECB Monetary Policy Divergence Looms
Fundamentals To Scope The Federal Reserve maintained interest rates at its recent meeting, with no significant modifications to the statement. The Dot Plot continues to indicate three rate cuts in 2024, and economic projections have improved, with higher growth and inflation and lower unemployment. US economic data has been mixed, with CPI and NFP surpassing Read More…


