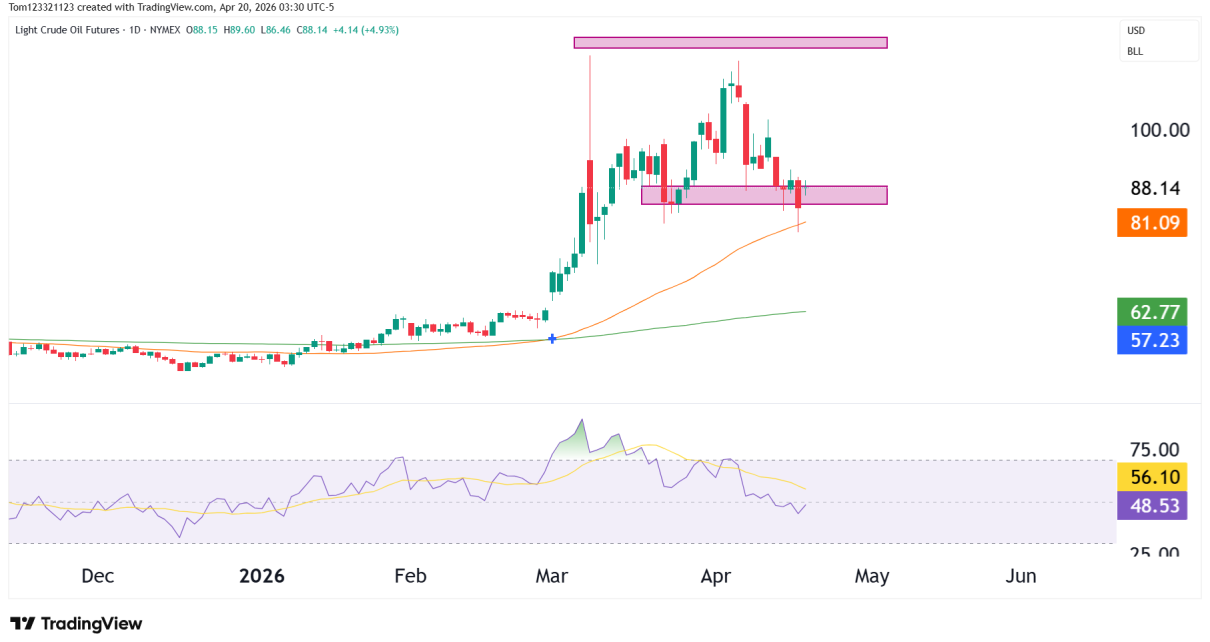
Stock price chart
Fundamental Analysis

Currency Futures Fall Despite Anticipated Early US Rate Cut

On Friday, currency futures fell despite a drop in US producer prices in December, increasing the likelihood of an early US rate cut. At the same time, the dollar fell after rising during the day due to safety buying following US and British military actions in Yemen. US producer prices (Source: Bureau of Labor Statistics) Read More…

Technical Analysis

Frightening evening star pattern on RTY futures

Weekly Chart Starting with the weekly chart, the E-Mini Russell 2000 Index Futures are oscillating within a defined trading range between approximately $1964.5 and $2000, with the ATH at $2463.7. The index is currently testing the upper boundary of this range. A convincing breakout above the range could signal a strong bullish sentiment, potentially targeting Read More…

Fundamental Analysis

Gold Hits One-Month Low on Surging Inflation

On Thursday, gold dropped to a one-month low as the dollar rose due to hotter-than-expected inflation data. Moreover, hawkish remarks from Fed officials raised concerns that higher interest rates might continue beyond March. The dollar index rose after US consumer prices rose more than anticipated in December because it potentially delays an anticipated US rate Read More…

Crude Oil Futures
Fundamental Analysis

US Crude Oil Prices Plummet as Stockpiles Soar

On Wednesday, US crude oil prices fell sharply due to an unexpected increase in US crude stockpiles. The report raised concerns about demand in the largest oil market.  WTI futures vs crude stockpiles (Source: Bloomberg, EIA) Despite an initial 1% gain, prices reversed direction following the US Energy Information Administration’s report. There was a surprise Read More…

Crude Oil Futures
Technical Analysis

CL Futures at POC – What’s Next for Oil?

Weekly Chart The weekly chart reveals a battle at a critical level for crude oil futures. A well-defined support zone at $71.50-$72.00 comes into focus, clearly marked by previous consolidation and the volume profile ‘point of control.’ This level represents a pivotal battleground between bulls and bears because it tells us that this is the Read More…