

Introduction
Working with the OneUp Trader program platform daily, I thought I’d share what the dashboard looks like, how it works, and the features it offers. If you’re considering a funded trading program or just curious about how these platforms operate, here’s an honest walkthrough of the OneUp Trader dashboard.
The dashboard is where traders track their progress, monitor risk, and manage their evaluation accounts. Understanding how it works can make a big difference, especially if you’re aiming to pass a funded trading challenge or improve your overall performance.
Who Is the OneUp Trader Dashboard For?
The OneUp Trader dashboard is designed for traders who are either completing an evaluation or managing a funded account.
It’s particularly useful for:
- Traders who want a clear view of their profit targets and drawdown limits
- Beginners who need structured guidance and simple performance tracking
- More experienced traders looking to analyze consistency and improve their metrics
If you rely on data to refine your trading, the dashboard gives you a centralized place to monitor your performance and make better decisions.
Social
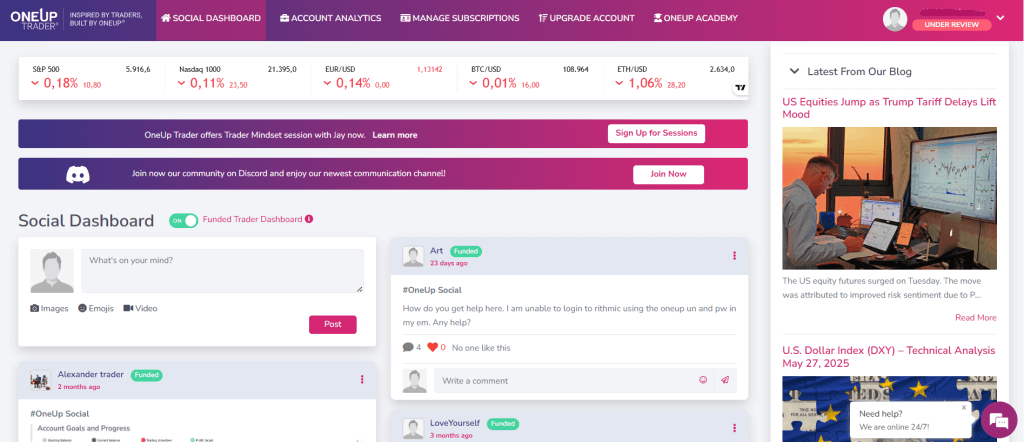
One feature many traders appreciate is the social dashboard. Trading can often feel isolating, so having a space where traders can share both wins and losses adds a human element that not all funded trader programs offer.
Traders regularly post screenshots of their trades, ask questions, and share mindset tips. The support team is also active within the community, and there is a live chat available 24 hours a day, seven days a week. In addition, the platform provides a daily feed of both technical and fundamental analysis.
Overall, it’s a solid community where traders can exchange ideas, learn from each other, and stay engaged with the markets beyond just their own charts.
Account Analytics
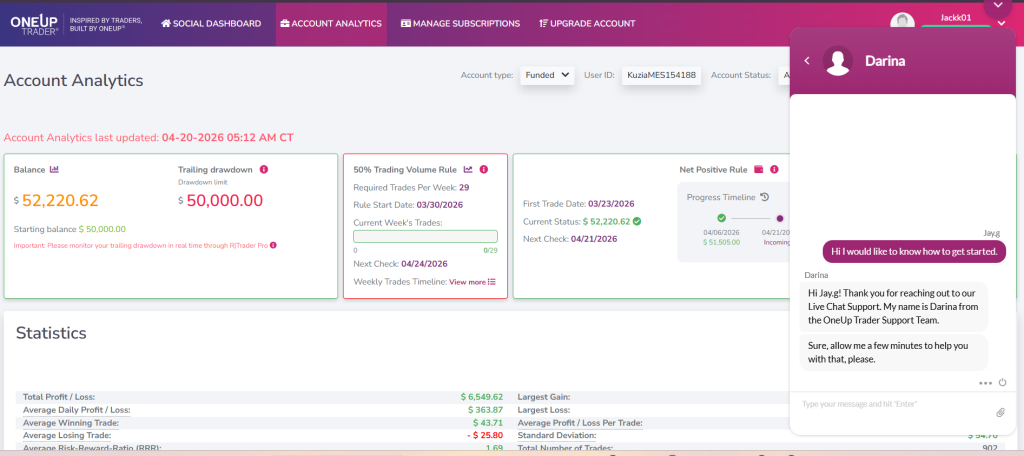
The account analytics section is where most traders spend their time. It shows your current balance, how close you are to your drawdown limit, and tracks your overall trading performance.
One of the biggest strengths of this section is how simple and clear it is. Your profit target, current progress, and key risk metrics are all visible in one place, without needing to move between different screens.
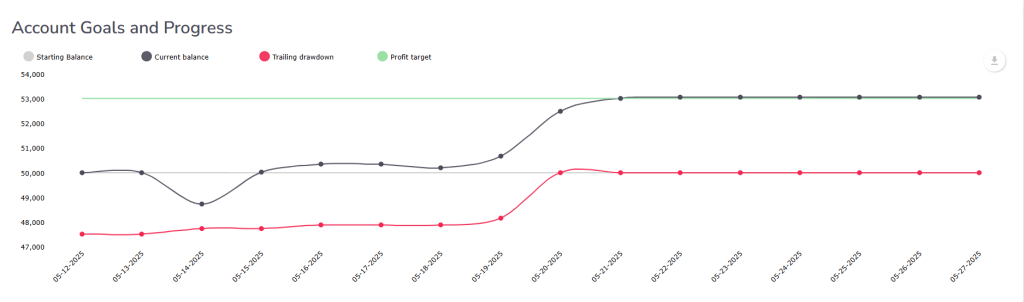
The goals chart provides a timeline view of your account, showing your starting balance, current position, and drawdown levels over time. This makes it easier to spot patterns in your trading, such as consistency, overtrading, or periods of drawdown.
Like any tool, its value depends on how you use the information. Traders who regularly review their data can use this section to improve decision-making and maintain better risk control.
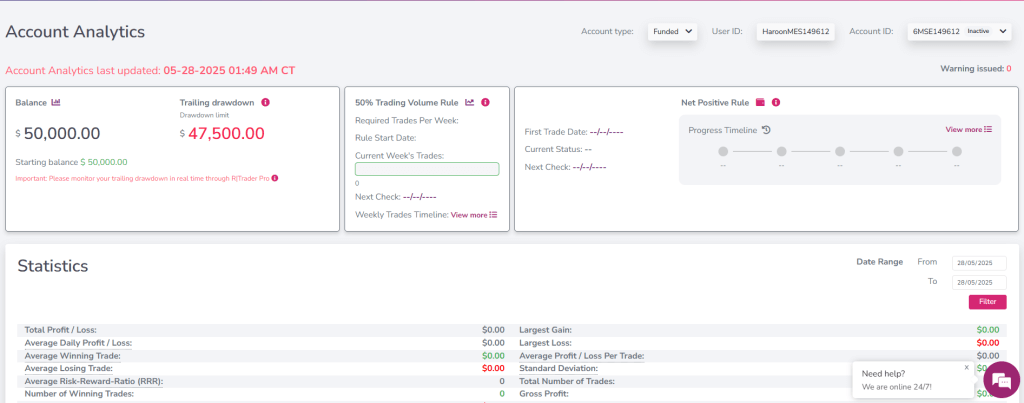
Balance and Trailing Drawdown (Funded Accounts)
One of the first things you’ll notice on the dashboard is your balance and trailing drawdown, like you can see in the chart above. This is very useful because it gives a visual representation of the drawdown that is trailing your account balance as it makes new highs.
The balance shows your current account value in real time. In the example above, the account has grown slightly from the starting $50,000 to $52,220.62. That part is straightforward.
The more important number is the trailing drawdown, which in this case is set at $50,000. This is your hard risk limit. If your account equity drops to that level, the account is breached. The drawdown also stops trailing once it reaches your starting account balance and doesnt move from there no matter how high the account balance goes.
We have found that overall, this is just a great section for traders because instead of having to only rely on the numbers from R|Trader, they get to see a simplified and easily understandable graph.
The 50% Trading Volume Rule Explained
Another rule displayed clearly on the dashboard is the 50% trading volume rule, which often catches traders off guard if they’re not paying attention.
In simple terms, this rule requires you to maintain consistent trading activity across the week and it is ONLY for funded traders. In the example shown, the requirement is 29 trades per week, and your progress is tracked in real time. The funding partners enforce this rule because they do not want the accounts to go dormant.
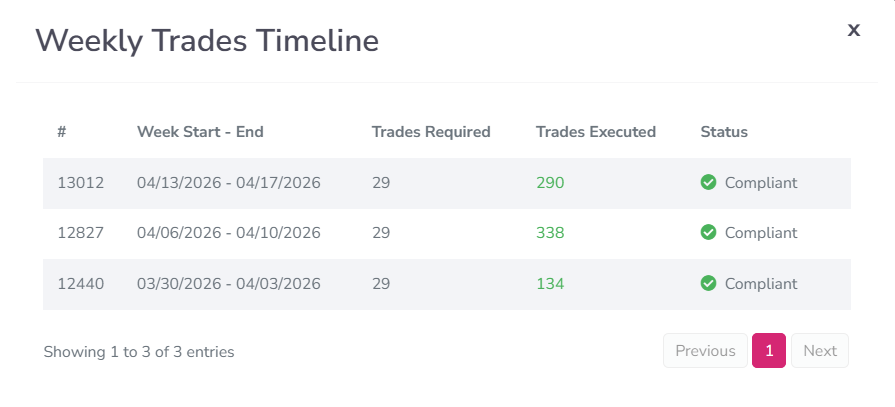
There’s also a timeline view that shows whether you’ve met the requirement in previous weeks. In this case, all prior weeks are marked compliant, which makes it easy to confirm consistency.
This in retrospect is not really a rule because if the funding partners notice that a trader is not keeping up with the minimum trade requirement then they simply notify the trader of the inconsistency.
The way it works is that traders are required to trade 50% of the volume they traded per week during their evaluation. Basically, if a trader opened 6 trades on average, then they only need to take a minimum of 3 once funded.
Net Positive Rule and Progress Tracking
The Net Positive Rule is another checkpoint built into the dashboard, and it’s designed to make sure your performance holds up over time.
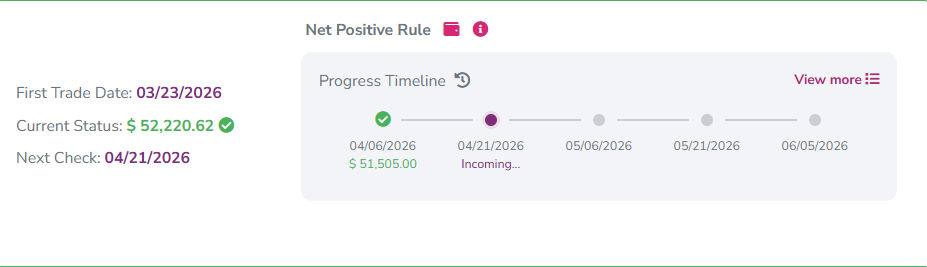
This section shows your trading progress across a timeline, including key dates and balance checkpoints. You can quickly see where you are, what’s been completed, and what’s coming next.
Statistics
The statistics section breaks down your trading performance into key metrics such as profit factor, risk-reward ratio, win rate, and average hold time.
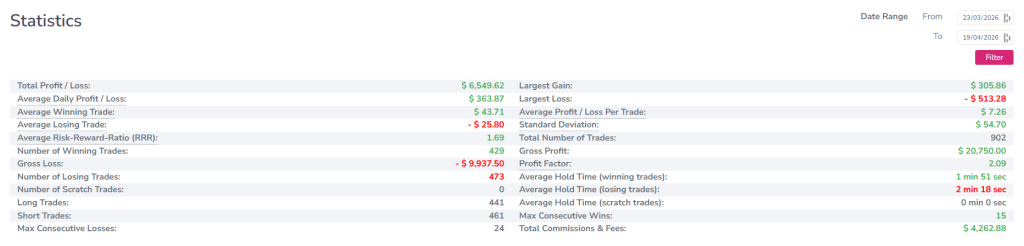
This is one of the most valuable parts of the dashboard, as it gives traders a clear view of what they are doing well and where they need to improve. Instead of relying on guesswork, you can use real data to evaluate your performance.
For many traders, collecting and calculating this information manually can take a significant amount of time. Having it all available in one place allows you to focus more on trading rather than tracking numbers.
For example, in the sample account above, a trader shows $6,549 in profit, a 1.69 risk-reward ratio, and a total number of 902 trades.
Account Access and Login Details
The dashboard also provides a dedicated section for your trading account credentials, including your Rithmic user ID and password making it easy to find.
This is where you access the details needed to connect your account to your trading platform. For funded traders, this section also includes funded account credentials, so there’s no confusion between evaluation and funded accounts.
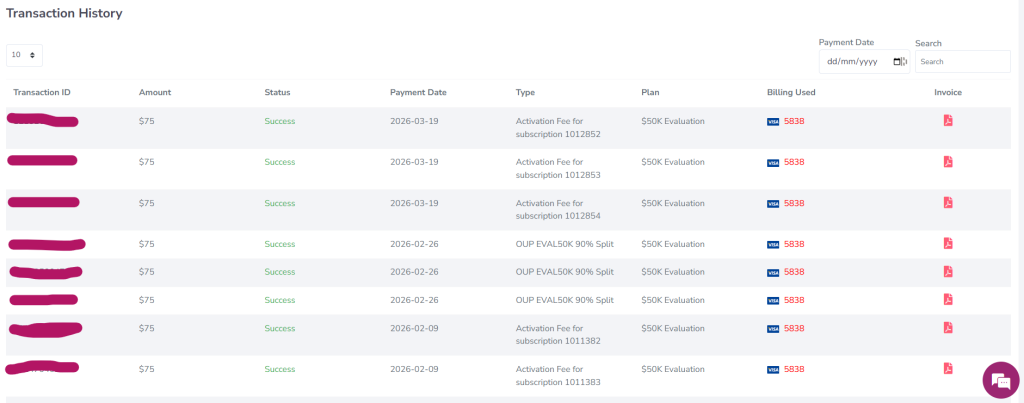
Transaction History and Billing Management
The platform also includes a full transaction history section, where you can review all payments, invoices, and subscription activity.
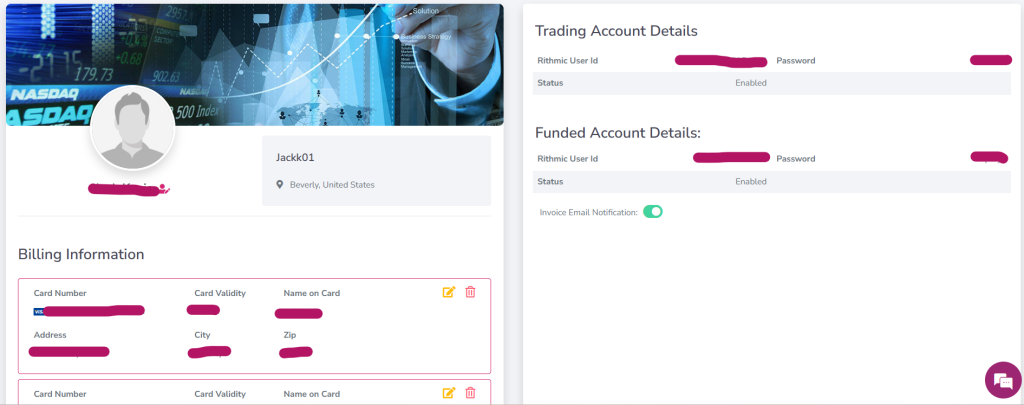
Each entry shows the amount, date, status, and plan details, along with a downloadable invoice. This makes it easy to track exactly what you’ve been charged and when.
There’s also a billing section where you can add or update your card details. You can store multiple payment methods, edit existing ones, or remove them as needed.
Built-In Blog and Trader Resources
On the right side of the dashboard, you’ll also find access to the platform’s blog and educational content.
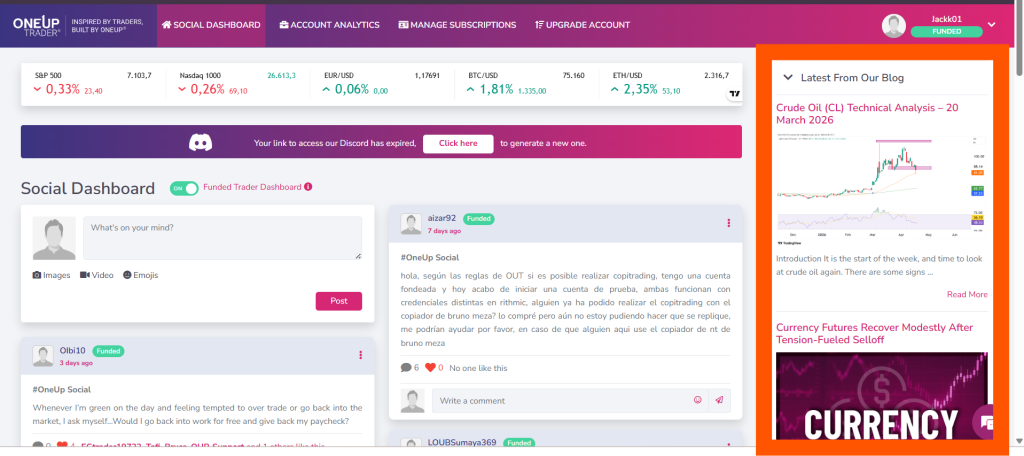
This section gives traders quick access to updates, tips, and general trading insights without leaving the platform. It’s not overly complex, but it adds another layer of value, especially for newer traders who want to keep learning.
There are daily technical and fundamental analysis articles as well as strategy and blog posts on traders who have made huge withdrawals. Below are examples of a funded trader who withdrew $73,000 in one go!
Instead of searching externally, you have a built-in resource hub available alongside your analytics.
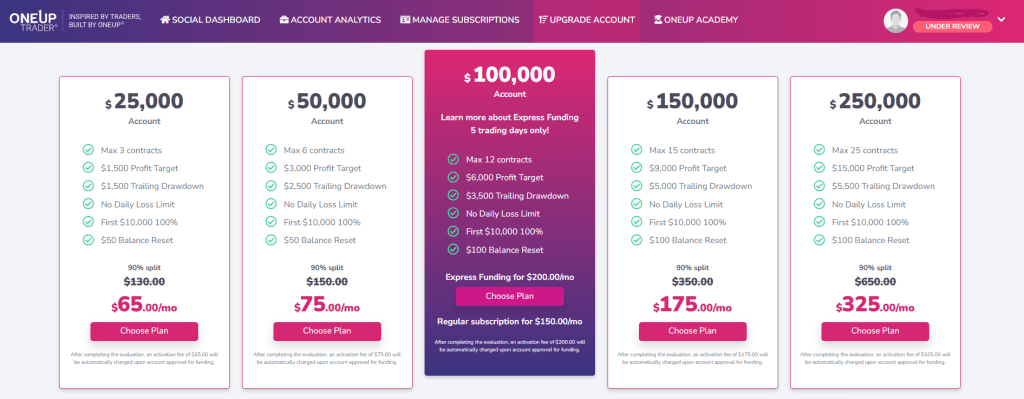
The Evaluations
The evaluation and plan selection process is simple and handled directly from the dashboard. Traders can choose from account sizes ranging from $25K to $250K, with clearly defined profit targets and rules.
One of the advantages here is how straightforward everything is. The requirements are easy to understand, and you can quickly see what’s needed to pass the evaluation without digging through multiple pages.
The 50% now, 50% later payment structure, where the remaining balance is only paid after successfully passing the evaluation, makes it more accessible for traders who don’t want to commit a large upfront cost.
Overall, the process is designed to be simple and transparent, allowing traders to focus more on performance rather than navigating complicated rules or systems.
Pros and Cons of the OneUp Trader Dashboard
Pros:
- Clean and easy-to-use interface
- Clear visibility of profit targets and drawdown limits
- Strong analytics and performance tracking
- Active community with social features
- 24/7 live chat support
Cons:
- Limited customization options for advanced user
Frequently Asked Questions
What does the OneUp Trader dashboard track?
The dashboard tracks your account balance, drawdown limits, profit targets, and detailed performance metrics such as win rate, risk-reward ratio, and trade history.
Is the OneUp Trader dashboard beginner-friendly?
Yes, the dashboard is designed to be simple and easy to navigate, making it suitable for both beginner and experienced traders.
Can you track your trading performance easily?
Yes, the analytics and statistics sections make it easy to monitor your progress and identify areas where you can improve.
Is the OneUp Trader dashboard available 24/7?
Yes, the platform is accessible at all times, and it also includes 24/7 live chat support for assistance.
Does the dashboard help improve trading performance?
It can, as long as traders actively review and apply the data provided. The dashboard highlights key metrics that can help identify strengths and weaknesses.
The Bottom Line
The OneUp Trader dashboard keeps things simple and practical. It covers the essentials, shows the data traders actually need, and includes community features that are genuinely useful.
It’s not packed with extra features, and that’s part of the appeal. The clean setup makes it easier to focus on what really matters: tracking your performance, managing risk, and building consistency over time.
Is it perfect? No platform is. More experienced traders might want more customization or advanced tools. But for most people, it does the job well and keeps everything clear.
If you’re comparing funded trading programs, it’s worth thinking about the dashboard too, not just the rules, pricing, or profit splits. You’ll be using it every day, so having something straightforward and easy to navigate can make a real difference.
