Introduction
Crude Oil Futures (CL) for the most part are trading in a consolidation phase. YTD CL is up 15%. However, the performance has been mixed, influenced by a stronger dollar and global economic concerns, such as the rebound in Russian crude exports (Barchart.com) (Barchart.com).
Weekly Chart Analysis
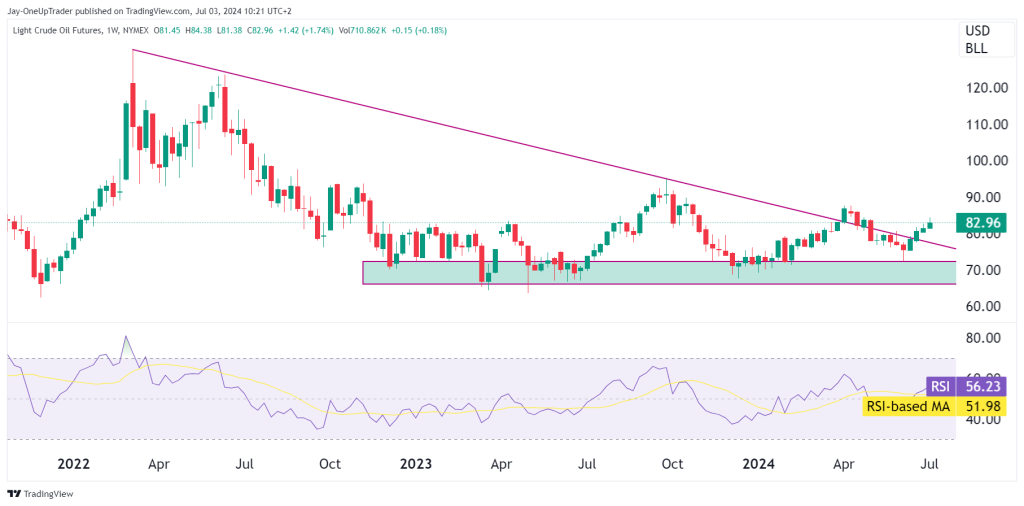
The weekly chart shows CL recently had a bullish breakout from the descending trendline that has been acting as resistance since early 2022. This breakout is significant as it tells us the prevailing downtrend is coming to an end. This means we could see the consolidation phase continue for sometime or a slow grind higher in prices.
Key Levels and Indicators:
- Descending Trendline: The breakout above this trendline, which has acted as resistance since early 2022, is a bullish signal.
- Support Zone: The support zone between $70.00 and $77.00 has provided a strong base for price rebounds.
- Resistance Level: The next resistance level to watch is around $90.00, which could serve as a target for the current bullish momentum.
- RSI Indicator: The RSI is at 56.23, indicating a neutral to slightly bullish momentum. The RSI-based moving average at 51.98 supports this view, showing that there is room for further upside before reaching overbought conditions.
Daily Chart Analysis
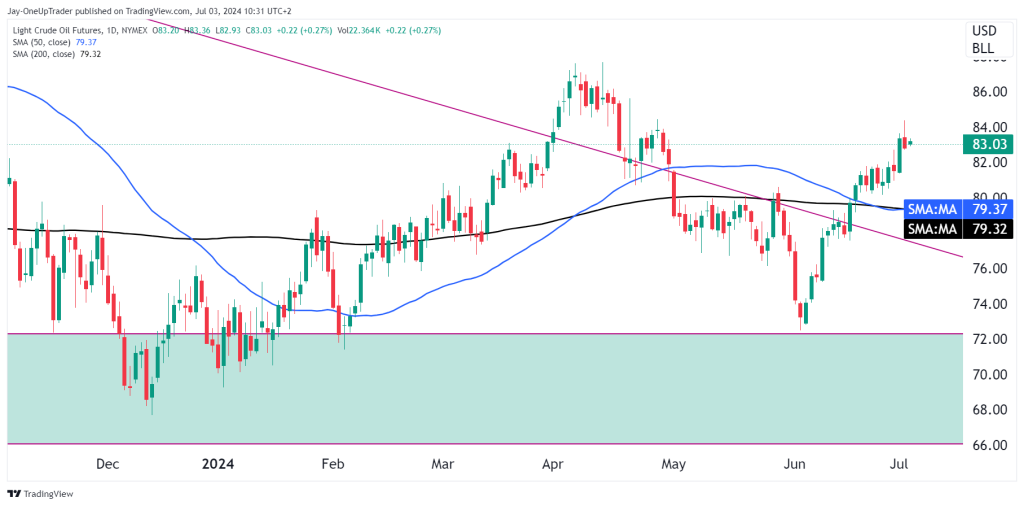
The daily chart complements the weekly analysis by showing a clearer view of the recent breakout and consolidation above the trendline. The price is currently holding above both the 50-day SMA at $79.37 and the 200-day SMA at $79.32, further reinforcing the bullish sentiment. However, the recent bearish daily candlestick from Tuesday July 2nd sessions is concerning for the bulls.
Key Levels and Indicators
- Immediate Resistance: The price faces immediate resistance at $83.00. A sustained move above this level could lead to a test of the $90.00 resistance mentioned in the weekly analysis.
Trade Opportunities
Long Position
- Entry: Consider entering a long position on a confirmed breakout above $83.00 with strong volume.
- Target: The initial target could be set around $90.00, with a potential extension to $100.00 if the bullish momentum continues.
- Stop-Loss: A stop-loss can be placed below the 50-day and 200-day SMAs, around $78.00, to manage risk.
Short Position
- Entry: A short position might be considered if the price fails to sustain above $83.00 and shows signs of a bearish reversal.
- Target: The target for a short position could be the support zone between $70.00 and $77.00.
- Stop-Loss: A stop-loss should be placed above the recent high, around $85.00, to limit potential losses.