Introduction:
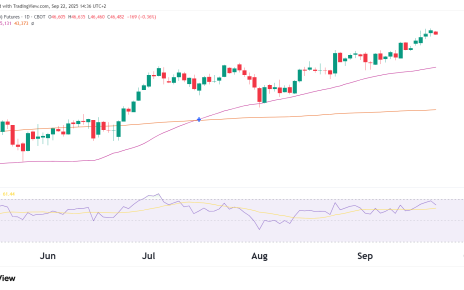
ES has surged an impressive 32% since its lows in October last year, showcasing robust bullish momentum. The upward-sloping 50-day moving average, standing significantly above the 100-day moving average (at $4440 and $4265), further bolsters the optimistic outlook. Although the Relative Strength Index (RSI) has slightly cooled down to 55 from 70 a week earlier, the market sentiment remains positive. Trading within a low-volume node as per the volume profile indicator, ES sits merely 5.7% away from its all-time high. Additionally, a recent bullish breakout from an inverted head and shoulders pattern, where the price surged from $4166 to the current level of $4564 (10%), adds to the strength of the uptrend.
Technical Analysis:
- Uptrend: S&P 500 Futures (ES) have experienced a remarkable uptrend, surging 32% since its lows in October last year. This substantial price increase indicates strong bullish sentiment and confidence in the market. Finding a bearish case in the current market environment would be difficult.
- Moving Averages: The 50-day moving average (MA), currently at $4440, slopes upward, significantly staying above the 100-day moving average at $4265. This moving average crossover reinforces the ongoing bullish momentum and signifies the potential for further upward movements.
- RSI Indicator: After reaching 70 on the daily chart a week earlier, the Relative Strength Index (RSI) has cooled down slightly to 55. This pullback is healthy for the overall trend as long as we see buyers re-enter the market and the price move above $4645, which is the most local high is this recent up trend.
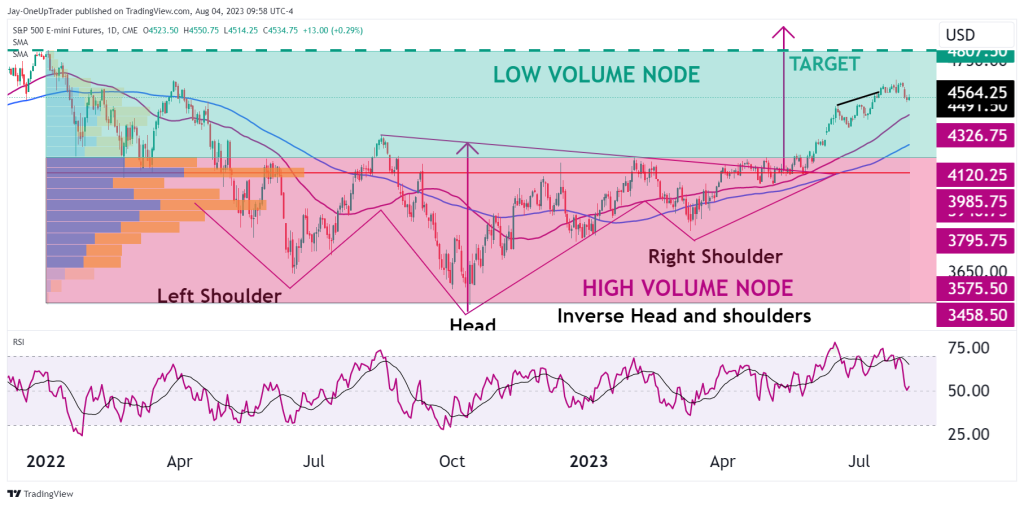
- Volume Profile: The price is currently trading within a low-volume node, according to the volume profile indicator. As I have mentioned before, the low-volume nodes have less liquidity and so prices can move more freely and faster in these regions. This indicates to us that we could still see decent upward momentum in ES.
- All-Time High Proximity: The all-time high is just 5.7% away from the current price, highlighting the market’s determination to reach new highs. This proximity indicates a bullish sentiment and potential for further gains.
- Inverted Head and Shoulders Breakout: The recent bullish breakout from an inverted head and shoulders pattern in the middle of May, with the price surging from $4166 to the current $4564 level, signifies a strong trend reversal and supports the bullish case.
Trading Opportunity:
The technical analysis points toward an ongoing bullish momentum in S&P 500 Futures (ES). The upward-sloping moving averages, the balanced RSI, and the proximity to the all-time high all suggest potential for further upside movements. Traders may consider long positions, especially on pullbacks, while keeping an eye on the support levels provided by the moving averages and the inverted head and shoulders breakout area.
However, as with any trading strategy, it is essential to exercise caution and implement proper risk management practices. The market can be unpredictable, and sudden events may influence price movements. It is advisable to use stop-loss orders to protect positions from unexpected adverse market conditions.
Note
It is important to keep in mind now that markets are back favoring the bulls. We should be careful in taking short positions but also in long positions. Don’t chase the market. Find a time frame that works for you and stick to it. Think objectively and stay in a probability-based state of mind. Don’t trade with your emotions. If you notice that your emotions are taking control, step away and come back when you are more relaxed. Remember that every time you take a position you should feel no change in your emotional state whatsoever.