


Introduction
The S&P 500 E-mini Futures (ES) has moved into the support zone at $6,800, marking roughly a 3% decline since the recent ATH made on the 29th of October. There are some signs of fatigue in the price action, but nothing of major concern yet for the bulls. Let’s take a closer look at the technicals and what they tell us.
Technical Overview
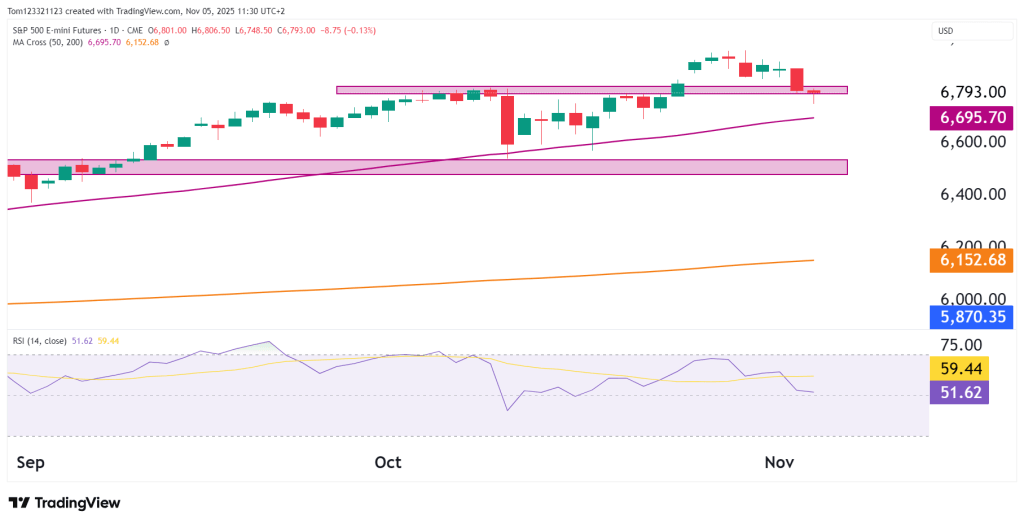
On the daily chart, the S&P 500 E-mini (ES) has pulled back from the 6,850–6,900 zone, which was the recent all-time high. The drop has brought prices back to a key support area between 6,770 and 6,780 — the same zone where the last breakout happened in mid-October and the previous ATH.
Just below that is the 50-day moving average at 6,695.70, which has been a strong support level all year long. As long as prices stay above it, the uptrend is still intact, and this dip looks like a normal pause in a bigger bullish trend.
But if ES closes below 6,680, it could mean a deeper pullback toward 6,625 or even 6,400, where stronger support levels sit. On the upside, resistance is at 6,850, then 6,900. A breakout above that would likely kick off a new rally toward 7,000 and beyond.
RSI & Momentum
The RSI has slipped to 51.6. This is a neutral zone, typical after the pullback in price action that we have seen, suggesting neither overbought nor oversold conditions. The indicator has eased from the high-60s seen earlier in October, creating room for potential recovery if buying resumes.
Key Technical Levels
| Type | Level | Description |
|---|---|---|
| Resistance 1 | 6,850 | Short-term ceiling. |
| Resistance 2 | 6,900 | All-time high zone. |
| Resistance 3 | 7,000 | Psychological level. |
| Support 1 | 6,770–6,780 | Current short-term support. |
| Support 2 | 6,695 | 50-day MA / trendline support. |
| Support 3 | 6,625 | Structural support / October pivot low. |
Probability Table (Next 2–3 Weeks)
| Scenario | Estimated Probability | Notes |
|---|---|---|
| Consolidation between 6,700–6,900 | 55% | Likely short-term range while momentum stabilizes. |
| Breakout above 6,900 → target 7,050 | 30% | Requires strong buying momentum. |
| Breakdown below 6,680 → retest 6,625–6,400 | 15% | Would mark deeper correction if sentiment weakens. |
Fundamentals
After several weeks of strong gains, the market is taking a breather as investors look for signs that rate cuts are still likely in early 2026. Fed officials have stuck to the “higher-for-longer” message but also noted that inflation is easing — a mix that’s kept stocks supported but limited their upside.
Earnings have mostly been solid, especially from big tech and financials. Still, with valuations near record highs, some investors are locking in profits. At the same time, Treasury yields have leveled off, which helps stocks but doesn’t spark strong new buying.
For now, volatility is low, and the pullback looks more like normal consolidation than a major trend change. Traders are waiting for the next big signal.
This analysis is for educational and informational purposes only and does not constitute trading advice or a recommendation to buy or sell any futures contracts. Futures trading involves significant risk and may not be suitable for all investors. Always conduct your own research and consult with a licensed financial professional before making trading decisions.