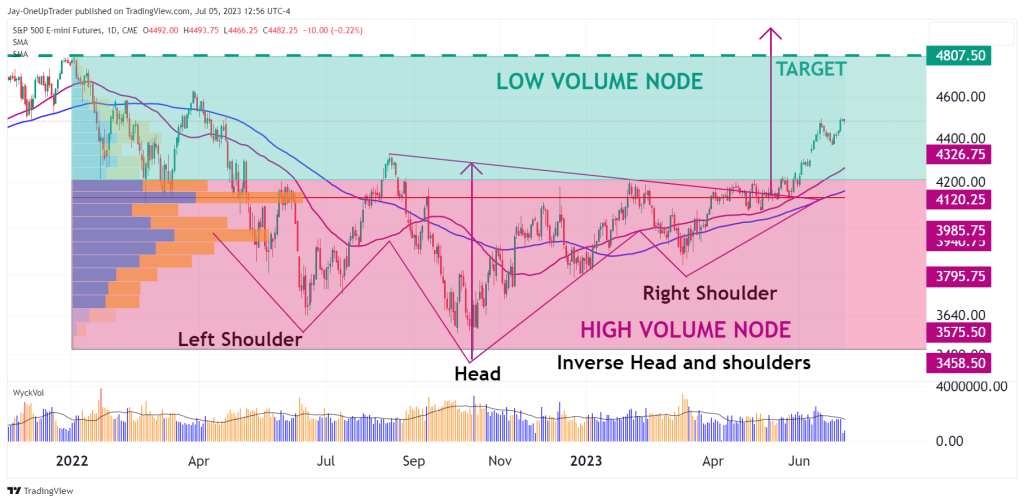
- ES is trading over 8% above the inverted head and shoulders neckline.
- Low-volume nodes have ES moving higher.
- 50 moving average clearly above 100 moving average.
Technical recap
It has now been almost two months since ES broke out of its inverted head and shoulders pattern on the daily chart. Price has surged 8% since then and continues to rise. Volume has decreased and is something bulls should take note of, but there is little to no case for bears. Let’s take a look at some technicals on the chart we can keep in mind moving forward.
Technical analysis
Volume profile: In the chart below, there is a pink and a green rectangle over the price action. The pink shows high-volume nodes, where there is a lot more liquidity, than the green square, which shows low-volume nodes and low liquidity. Price tends to move quickly through low-volume nodes because the liquidity is thin and finds support or resistance at high-volume nodes when the liquidity is thicker. ES has been rallying with power through the low volume and is on its way toward testing all-time highs of $4,809.
Volume: The volume is decreasing on average.
50 MA over 100 MA: The 50 moving average is clearly above the 100 moving average and has been since January of this year.