

- Mixed factors impacting ZB’s price action as bulls and bears battle for dominance.
- Break below critical diagonal support trend line challenges bullish technical formation.
- Death cross formation and downward RSI signal bearish control in the market, with support levels at 122’23 and 118’08.
Introduction
There are a mixed bunch of factors playing into ZB’s price action, which we will look at below. Bulls and bears are fighting, and we can’t be sure which will come out on top. Let’s take a look at some of the technicals that might give us an idea of what looks to be the best side.
Technicals
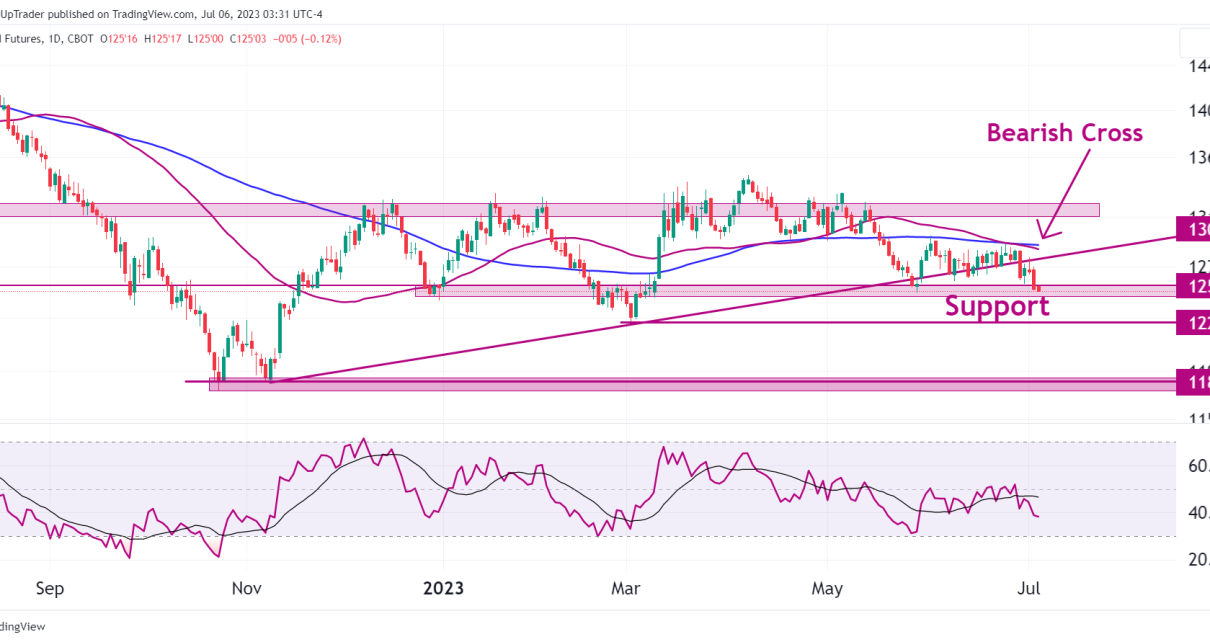
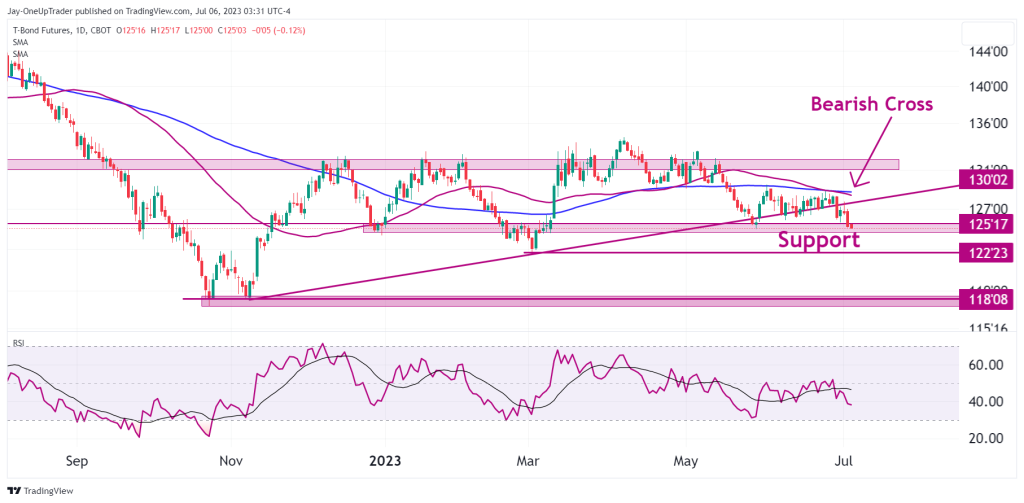
ZB has broken below its diagonal support trend line, which was critical in the ascending triangle formation. The triangle has not completely been dismantled yet, but we would need to see price rally significantly in the new few days for it to remain a bullish technical formation.
The 50 MA has crossed below the 100 MA. This death cross on the daily is a sign that bears are gaining control. This formation means on the past 50 days, price has closed lower than the past 100 days on average.
The RSI is pointing downwards but still has a way to go until it reaches oversold territory. This is one of the reasons why the bears are in control of this market at the moment. Longs around these levels appear to be significantly less on the side of probabilities than shorts.
A few support levels below give bears targets to aim for. The first is 122’23. The second is 118’08.

