Weekly Chart Analysis:
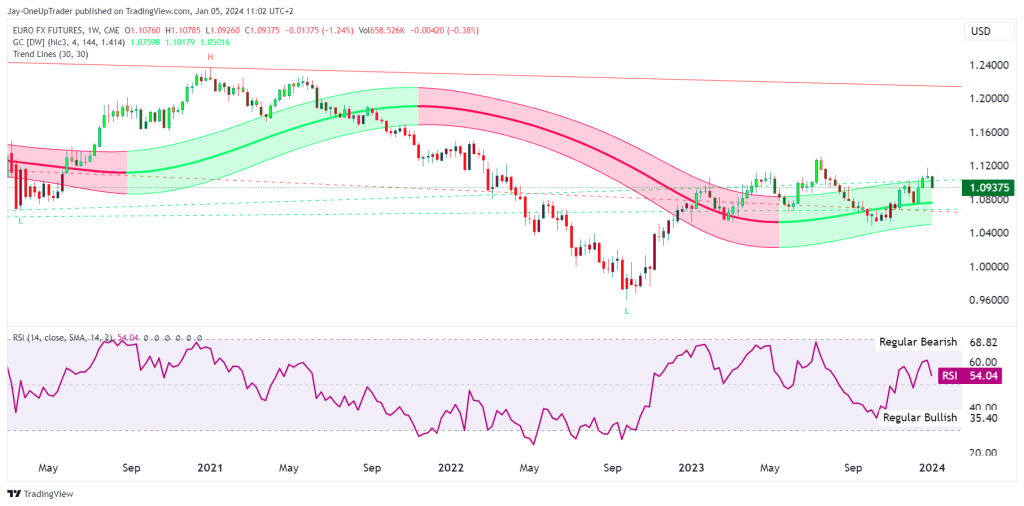
The weekly chart shows the price fluctuating within the Gaussian channel. The recent trend is sideways, with the price fluctuating between the upper and lower bands of the channel. The ‘Higher High’ (H) and ‘Lower Low’ (L) indicate a lack of a clear long-term trend. The RSI is at 54.37, which is neutral, signaling neither overbought nor oversold conditions. This suggests indecision in the market. Since price is at the top range of the Gaussian channel and we see the formation of a possible evening star pattern, long may need to be avoided for now.
Key Observations on Weekly Chart:
- Support Zone: The lower green band of the Gaussian channel, which the price has tested several times without breaking.
- Resistance Zone: The upper red band of the Gaussian channel, which has capped upward movements.
Trade Consideration on Weekly Chart:
- Long Position: Potential buy near the support zone (lower end of Gaussian channel) with a stop-loss order below the most recent ‘Lower Low’ (L).
- Short Position: Possible around current levels with a stop-loss order above the most recent ‘Higher High’ (H).
Daily Chart Analysis:
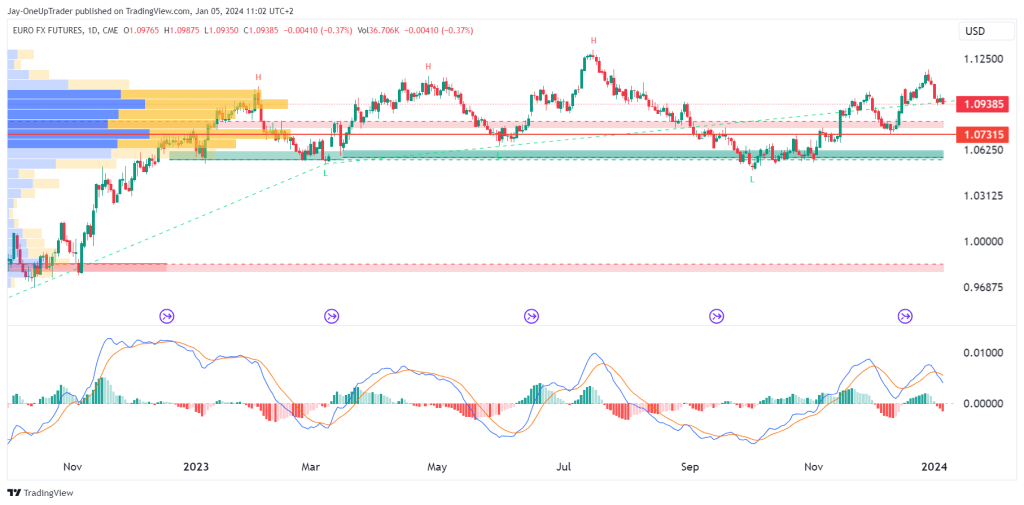
The daily chart provides a more defined view, showing the price moving within a range defined by clear support and resistance levels. Price has been in a sideways range for the majority of 2023, and if history repeats itself, the likelihood of a downward move from here is higher than not.
Key Observations on Daily Chart:
- Immediate Support: The point of control line at 1.07315, has been respected several times and normally acts as a magnet for price.
- Immediate Resistance: The local ‘Highs’ (00H) around the 1.10415 area is where price is struggling to break above.
Trade Consideration on Daily Chart:
- Range Trading: Buying at or near support (POC & $1.0625) and selling at or near resistance could be a viable strategy until a breakout occurs.
- MACD for Confirmation: A cross above the signal line could indicate a short term bullish shift, while further divergence could signal bearish continuation.
15-Minute Chart Analysis:
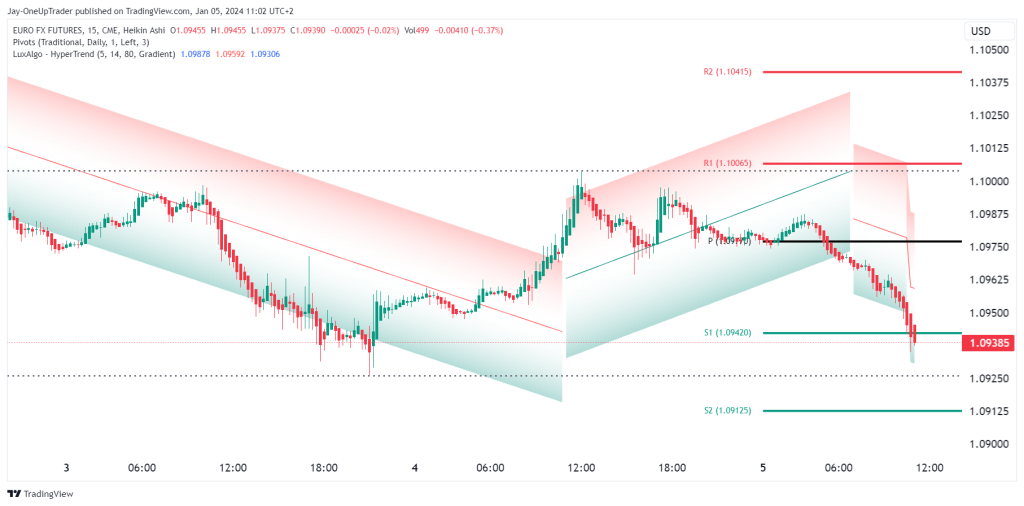
The 15-minute chart using Heikin Ashi candlesticks, which are useful for identifying trends, shows a short-term downtrend. The LuxAlgo HyperTrend indicator shows the bearish trend that has occurred and is likely to continue. Pivots provide tight levels for intraday support and resistance that we can aim for as price is sitting on S1 now. If S1 doesn’t hold, the next target is S2.
Key Observations on 15-Minute Chart:
- Pivot Point (P): Acting as a short-term equilibrium price, around which intraday trades can be planned.
- Immediate Support (S1): Close to 1.09420, a potential area for short-term bounce trades.
Trade Consideration on 15-Minute Chart:
- Scalping: Quick trades near pivot levels, with tight stop-losses to capture small movements.
- Trend Reversal: Look for potential reversal patterns or the hyper trend turning neutral or bullish before considering long positions.
While the weekly and daily charts indicate a range-bound market, the 15-minute chart suggests a short-term downtrend. Traders should focus on the key support and resistance levels highlighted and use the RSI and MACD to help confirm potential entries and exits. Risk management through stop-losses and taking profits at key levels is crucial to ensure discipline in trading.