

Introduction
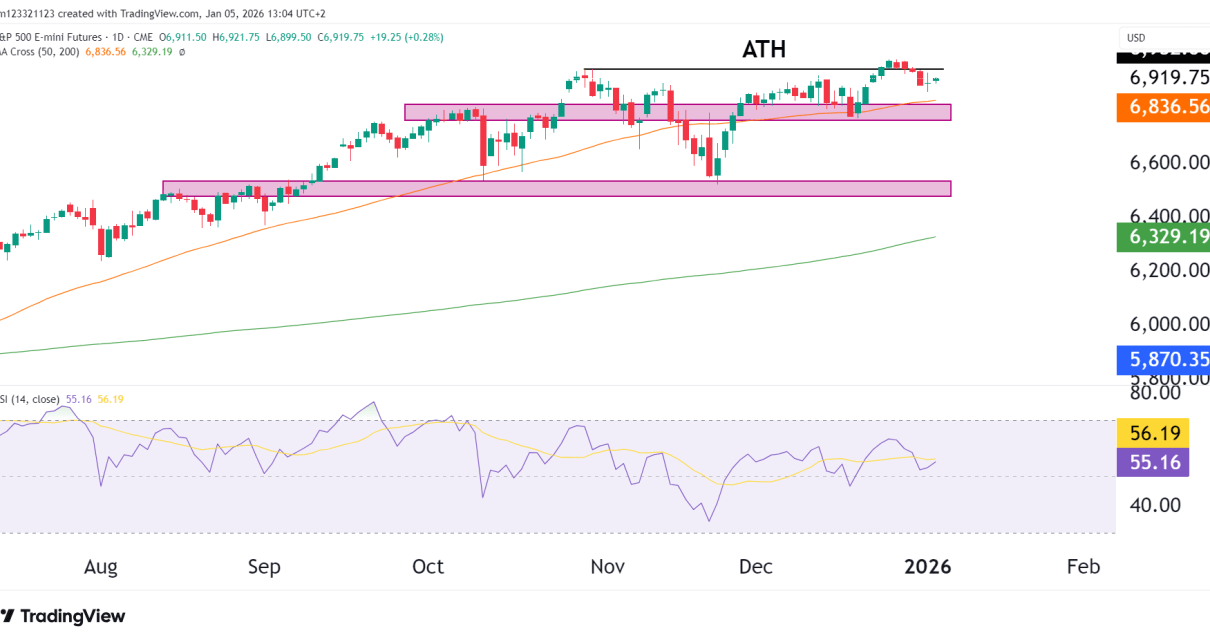
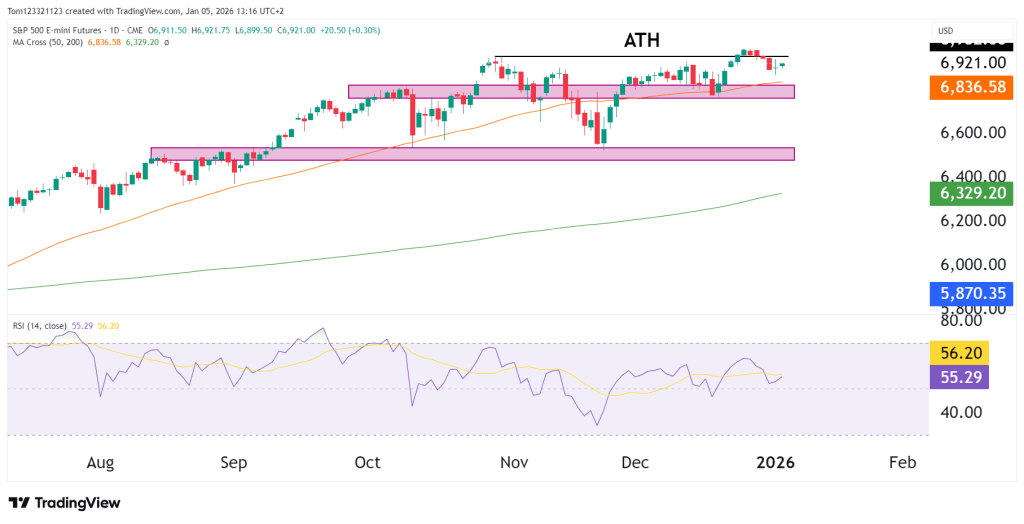
ES continues to consolidate just below all-time highs, with bulls pushing the price up after each pullback. The 50 moving average is still holding as support, and as long as bulls maintain that, the momentum is firmly on the upside. The market is closely watching U.S. inflation data, labor market reports, and FOMC but let’s take a closer look at the technicals and what they are telling us first.
Key Technical Levels
Resistance
- 6,950–7,000: All-time high region and near-term upside cap
- A sustained move above this zone would signal trend continuation
Support
- 6,800–6,850: Prior breakout zone and short-term support
- 6,550–6,600: Major demand zone and structural support
- 6,330: 200-day moving average and longer-term trend support
Moving Averages
- 50-day MA: Rising and acting as dynamic support
- 200-day MA: Well below price, confirming strong longer-term trend health
The separation between price and the 200-day MA shows just how extended the trend is and how strong the bullish momentum has been.
RSI remains above 50, indicating bullish momentum is still intact. However, the lack of strong upside acceleration suggests momentum is neutral-to-positive, aligning with the current consolidation phase rather than aggressive trend expansion.
Possible Outcomes
- Bullish continuation:
A clean break and hold above the ATH region would likely open the door to further upside. - Range continuation:
Price may continue oscillating between 6,800 and 7,000 as the market digests gains. - Deeper pullback:
A loss of 6,800 could trigger a rotation back toward the 6,550–6,600 support zone without breaking the broader trend.
Estimated Probability Scenarios
| Scenario | Description | Estimated Probability |
|---|---|---|
| Bullish continuation | Break and hold above ATH | 40% |
| Range consolidation | Sideways between 6,800–7,000 | 45% |
| Deeper pullback | Rotation toward 6,550 support | 15% |
Fundamentals
ES continues to be supported by expectations of easier monetary policy later in 2026, strong corporate earnings, and strong liquidity. Traders and investors are closely monitoring U.S. inflation data, labor market reports, and Federal Reserve communication for confirmation that rate cuts remain on track.
Any upside surprises in inflation or shifts toward tighter financial conditions could introduce volatility, while softer data may reinforce the prevailing risk-on environment.
This analysis is for educational and informational purposes only and does not constitute trading advice or a recommendation to buy or sell any futures contracts. Futures trading involves significant risk and may not be suitable for all investors. Always conduct your own research and consult with a licensed financial professional before making trading decisions.