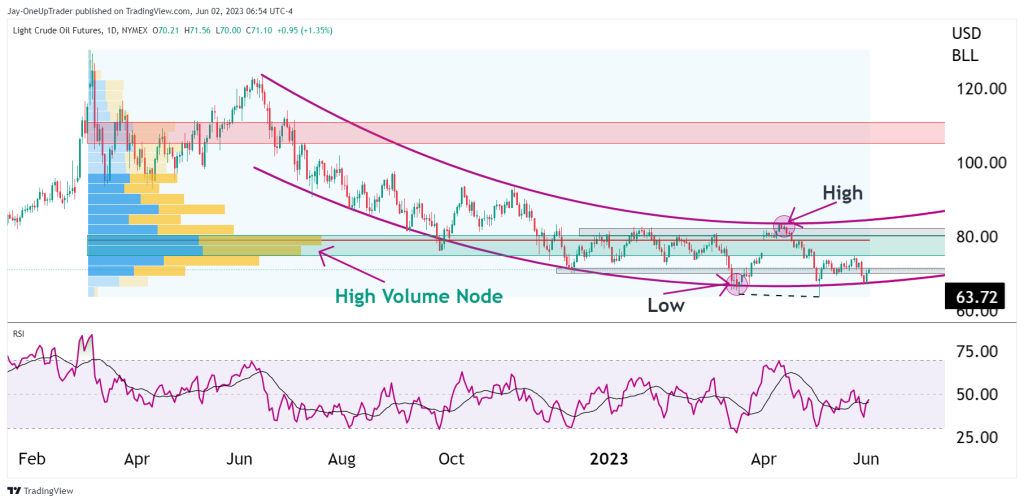
- RSI bullish Divergence: The daily chart’s Relative Strength Index (RSI) shows bullish divergence, signaling a potential price reversal.
- Strong Support Zone: Prices are bouncing off a robust support zone at $66 per barrel, indicating high demand and preventing a drop below $60.
- Support from Parabolic Curve: The long-standing parabolic curve is acting as support, providing additional bullish strength to the market.
Technical analysis
RSI: There is bullish divergence on the Relative strength index on the daily chart.
Support zone: Prices are bouncing off a support zone at $66 per barrel. Bears have tried multiple times to push the price below this level, but there is a high demand for Oil at this price. This keeps CL from dropping below $60.
Parabolic curve: The big parabolic curve, almost one-year-old, is acting as support, too, adding further fuel to the bullish case.
Point of control volume profile: The point of control line is currently sitting at $79, and it looks like bulls are targeting this level in the near term.
Ideas
Traders who wish to take advantage of this price action off the parabolic curve can take longs at current levels setting stops below $67. Targets of $79 and then $83 are on the cards for bulls. The high volume node at $79 is likely going to lead to a lot of resistance, so there is no point in holding through that level in hoping bulls will push through it.