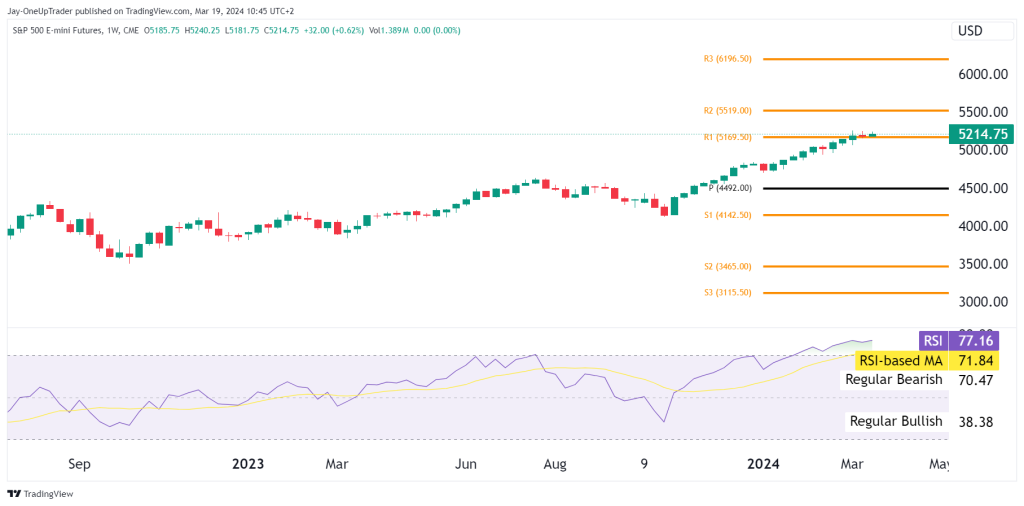
Weekly Chart Analysis:
ES is trading above its weekly pivot point, with immediate support at 4492.00 USD. The RSI is in the overbought territory, showing strong bullish momentum. The next resistance levels are R1 at 5169.50 USD and R2 at 5519.00 USD.
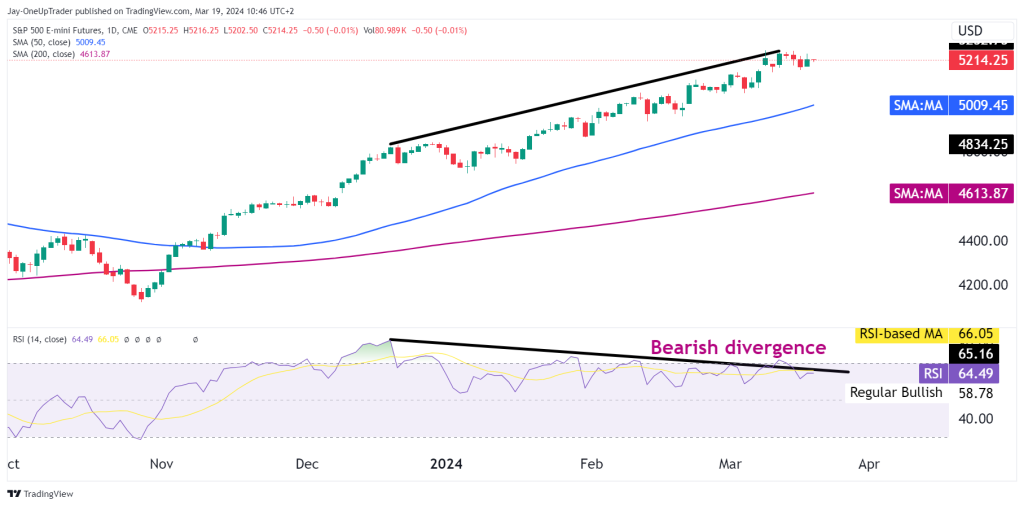
Daily Chart Analysis:
A potential bearish divergence is creating some worry for bulls as the price is making higher highs, while the RSI is not. The buying pressure is less even though the market continues to rally. The price is above both the 50-day SMA and 200-day SMA, a bullish signal. The bearish momentum is a worry for bulls however and might lead to some sideways action.
Trading Opportunities:
- Bullish Scenario: Traders could look for a continuation of the bullish trend with entries on minor pullbacks towards the 50-day SMA or the pivot point, setting a target towards the R1 level with a stop-loss just below the 50-day SMA or the pivot point.
- Cautious Scenario: Due to the RSI divergence, setting a tighter stop-loss and monitoring the trade closely for signs of reversal is advisable.
Rating:
While the setup shows an overall bullish trend, the bearish divergence signals the need for caution. Hence, the rating for this trade setup would be moderately bullish. It’s important to wait for confirmation of the trend continuation or reversal before entering the trade.