


Introduction
The E-mini Russell 2000 Index Futures (RTY) continues to follow the major indices upward be it at a slower pace, but price action has started to consolidate just below resistance near 2,535.2 (R1 pivot). Small-cap stocks have shown impressive resilience in recent sessions, holding above support zones and maintaining bullish momentum.
Technical Overview
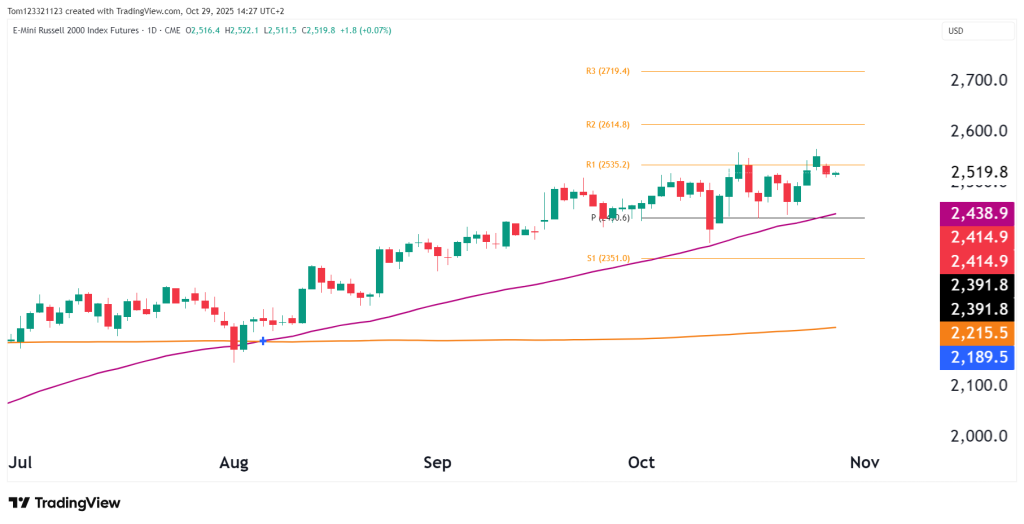
On the daily chart, RTY is still in a clear uptrend, trading well above its 50-day (2,438.9) and 200-day (2,215.5) moving averages — both have been reliable trend signals this quarter.
After bouncing from support around 2,414–2,440, RTY climbed toward 2,520–2,530, where it’s hit resistance several times. This suggests the market is taking a breather, possibly setting up for another move higher if it can break above 2,535.
A breakout above that level could open the way to 2,614.8 (R2) and even 2,719.4 (R3), which would be new highs for the year.
But if it loses momentum and drops below 2,440, a deeper pullback toward 2,351 is possible — a level that held back in mid-October.
Overall, the trend remains bullish, with rising highs and lows. The current pause looks more like a setup for another push higher, not a top.
Key Technical Levels
| Type | Level | Description |
|---|---|---|
| Resistance 1 | 2,535 | R1 pivot / short-term breakout zone |
| Resistance 2 | 2,614.8 | R2 pivot / extended upside target |
| Resistance 3 | 2,719.4 | R3 extension / major bullish projection |
| Support 1 | 2,440 | 50-day MA / lower consolidation boundary |
| Support 2 | 2,351 | S1 pivot / October swing low |
| Support 3 | 2,215 | 200-day MA / long-term trend floor |
Probability Table (Next 2–3 Weeks)
| Scenario | Estimated Probability | Notes |
|---|---|---|
| Bullish breakout above 2,535 → target 2,615 | 50% | Uptrend intact. |
| Sideways consolidation (2,440–2,530) | 40% | Common before breakouts. |
| Correction below 2,440 → retest 2,350 | 10% | Would indicate fading momentum or risk-off sentiment. |
Fundamentals
Small-cap stocks, tracked by the Russell 2000, are gaining attention as investors expect the Fed to pause or possibly cut rates in 2026. That’s boosting interest in smaller, U.S.-focused companies that are more affected by borrowing costs.
Still, there’s plenty of uncertainty — with mixed U.S. data and global tensions — which likely explains why RTY is struggling near resistance. Traders are watching for more direction from upcoming Fed comments and jobs data.
Even with these risks, stronger liquidity, solid earnings, and ongoing technical support are helping keep the outlook for small caps positive in the medium term.
Summary
E-mini Russell 2000 Futures are steady just below key resistance at 2,535, trading in a tight range after a strong rebound in Q4. The technical picture still looks bullish, with rising moving averages and solid momentum.
As long as the price stays above 2,440, the uptrend is intact. A clear breakout above 2,535 could lead to a move toward 2,615–2,720. If not, the market may keep moving sideways into early November.
This analysis is for educational and informational purposes only and does not constitute trading advice or a recommendation to buy or sell any futures contracts. Futures trading involves significant risk and may not be suitable for all investors. Always conduct your own research and consult with a licensed financial professional before making trading decisions.

