

Introduction
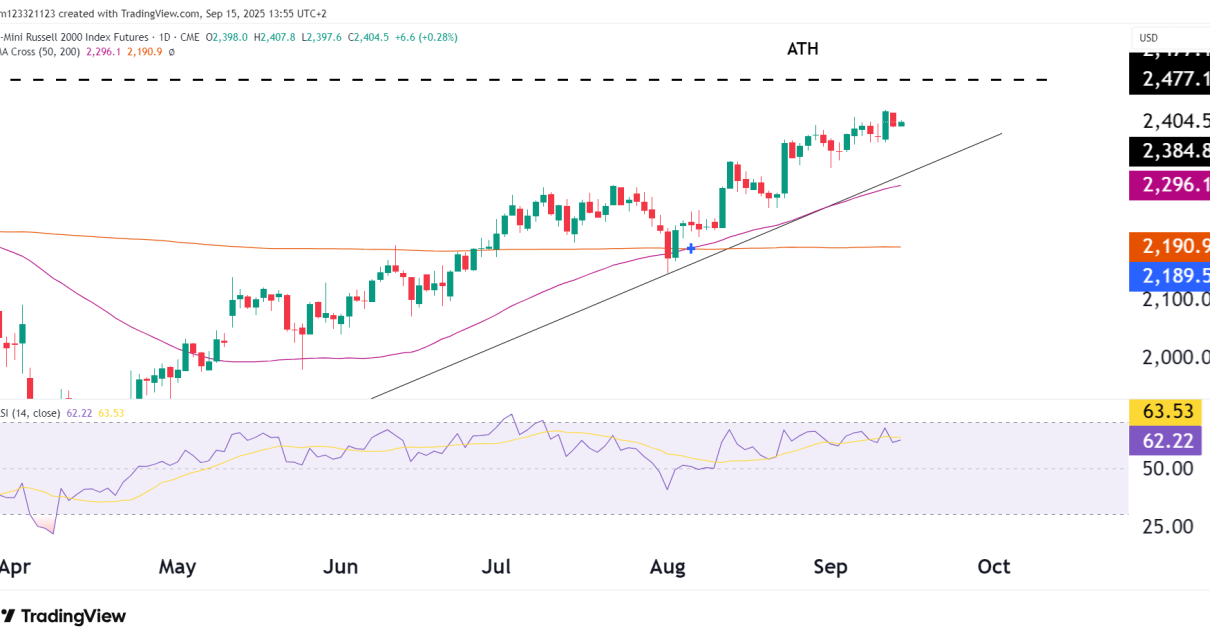
RTY continues its upward trend, holding its rising trendline and staying above the 50 and 200 moving averages. With the all-time high at 2,477 approaching, the small-cap index is showing notable resilience, keeping pace with the bigger U.S. indices.
Technical Analysis
- Trendline Support: RTY has been trending higher since the July lows, with price hugging the ascending trendline — a sign of healthy upward momentum.
- Moving Averages: Both the 50-day (2,296) and 200-day (2,190) moving averages are trending upward and offering layered support beneath current price levels.
- Resistance Test: The ATH at 2,477 remains the key upside barrier. Momentum looks strong, but the market is approaching an important zone.
- Momentum Indicators: RSI sits at 62, showing room for further upside before overbought conditions (>70). Momentum is constructive but not extreme.
Key Levels
| Level | Type | Note |
|---|---|---|
| 2,477 | Resistance | All-time high, key breakout level |
| 2,405 | Resistance | Minor resistance near recent highs |
| 2,296 | Support | 50-day MA, first layer of defense |
| 2,191 | Support | 200-day MA, major floor |
| 2,100 | Support | Trendline and psychological level |
Outlook
- Bull Case:
If RTY breaks above 2,405 and sustains momentum, the ATH at 2,477 becomes the next target. A clean breakout would likely invite broader participation in small caps, signaling an improving risk appetite. - Bear Case:
A failure to push above current resistance and a close below the ascending trendline (~2,350) could trigger a retest of 2,296 (50-day MA). A deeper correction might target the 200-day MA at 2,191.
Final Takeaway
RTY is building energy just below its all-time high, with a constructive trend and strong support structure. The rally isn’t overextended, leaving upside potential if bulls can push through 2,405–2,477. However, small caps often move sharply around key breakout levels — so a rejection at ATHs could bring swift pullbacks.
