- Technical Analysis: In-depth analysis of Gold using technical indicators and price action patterns.
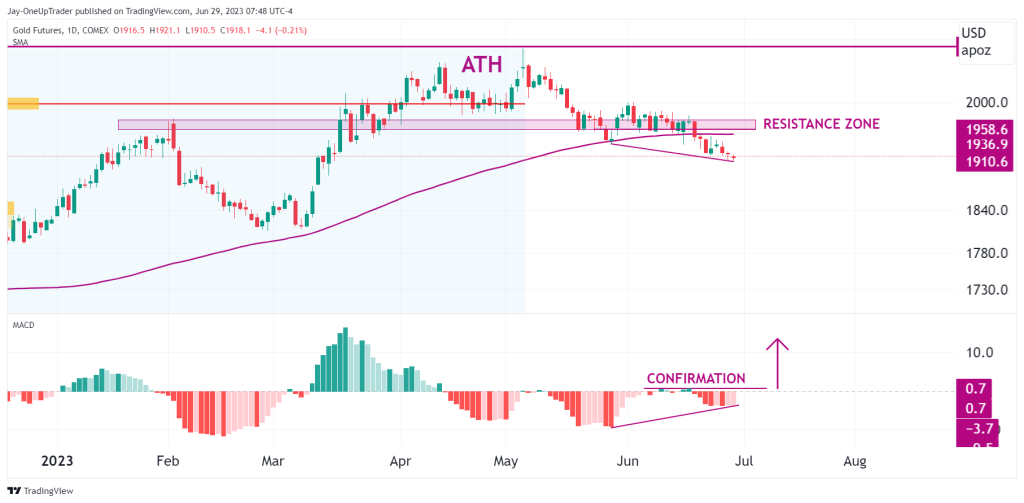
- MACD Divergence: Strong bullish divergence on the daily timeframe suggests ignoring short trades and waiting for a bullish reversal signal.
- Resistance Zone and 100 MA: Minor resistance zone at $1,958.6 and the 100 moving average at $1,951 pose challenges for bulls in pushing through.
Technical analysis
MACD Divergence: This is the main focal point for our Gold analysis this week. It shows strong bullish divergence on the daily time frame. This is a signal that short trades are likely better to be ignored for now. It is not a direct signal to take longs though, we may see price action sit sideways for a while before we see a small support pocket form, at which we can look for a bullish candlestick reversal to enter into a long postition.
Resistance Zone: There is a minor resistance zone at $1,958.6 which bulls would set as their first target if they take control. From there it would be the all time high.
100 MA: The 100 moving average is resting at $1,951 which is just below the resistance zone. The price level between $1,951 and $1,958 is likely to be a difficult level for bulls to push through.
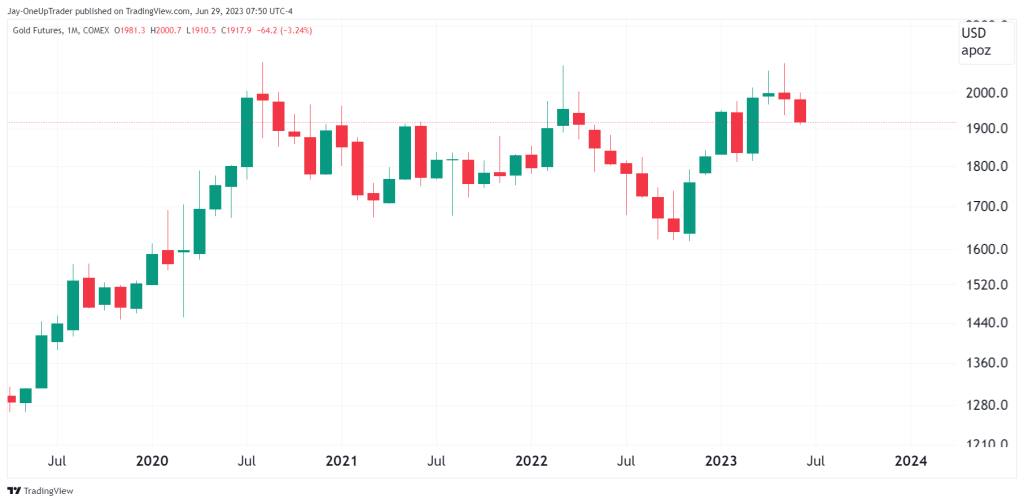
Monthly Chart
The monthly chart does not look pretty for the bulls. There are two bearish candlesticks when GC attempted to push through the all time high. The candle for this month is busy confirming with only a few days left which could lead to additional selling pressure for the next few weeks.