


Introduction
In the February 13 analysis, NQ had rejected off the all-time highs, forming a double top.
Since then, price action has confirmed rejection from that zone. Momentum is stuck now and there is a fight between the bulls and the bears.
The market is ranging now, but as long as the price does not fall below 21,190, the bulls still have a strong chance of eventually breaking above the all-time highs.
Let’s take a closer look at the technicals and what they are telling us.
What Has Changed Since February 13?
Then:
- Price rejecting all-time highs.
- Double top forming
- Momentum weakening
Now:
- Confirmed rejection from 26,200 area
- Sharp selloff into 24,600
- Relief bounce back toward 25,400–25,500
- Weekly structure still beneath major resistance
The double top remains active unless invalidated.
Market Structure & Trend
Weekly Chart
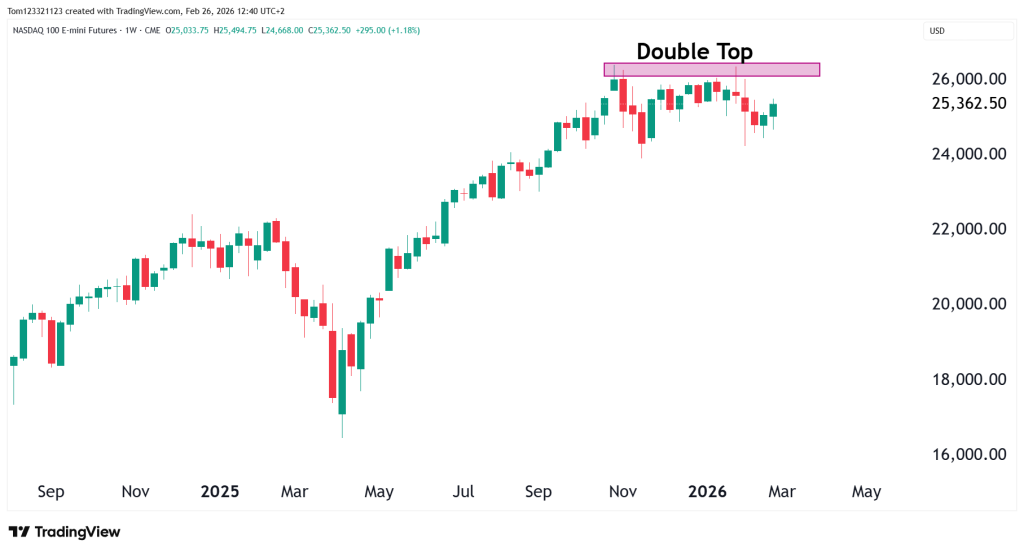
The weekly timeframe clearly shows:
- Resistance band at 26,000–26,200
- Two major rejections from that zone
- No weekly close above resistance
- Momentum stalling near highs
The bulls have found some power, and if this week closes green, it would lean toward the momentum shifting back to bullish unless the candle after that is a bearish engulfing. Traders can strategically watch the daily chart and lower time frames for pullbacks to enter with stops below this week’s low of 24,668.
Daily Chart
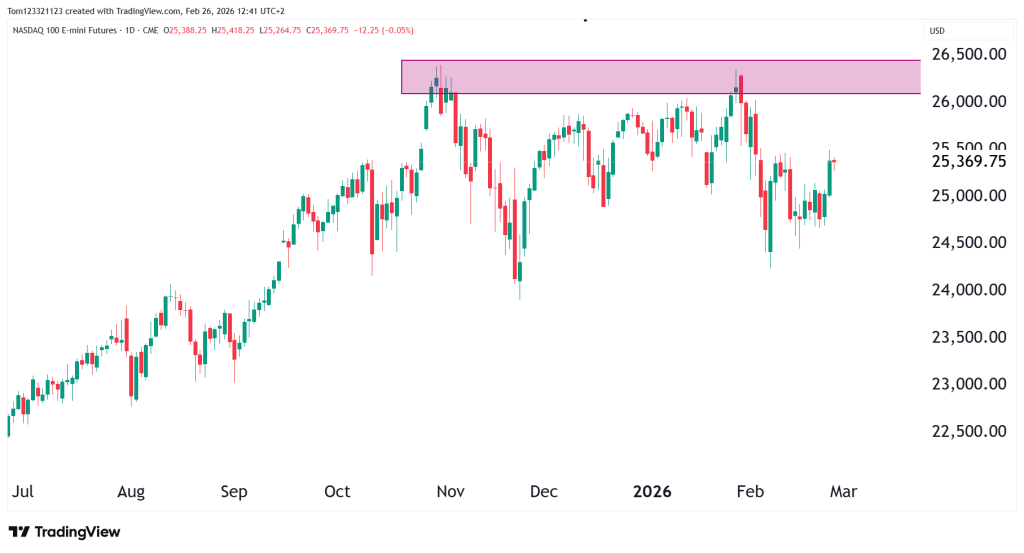
The daily structure shows:
- Breakdown from resistance
- Impulsive move into 24,600
- Bounce back toward 25,300–25,500
- Lower high potentially forming
Key Technical Levels
Resistance
25,800–26,200:
Major supply zone. This remains the invalidation level for the bearish thesis.
A strong daily and weekly close above 26,200 would negate the double top and reopen price discovery.
Support
24,500–24,700:
Recent swing low and reaction zone.
24,000:
Psychological level and prior structure support.
23,500–23,700:
Deeper structural support if the correction accelerates.
Looking Forward
Bearish Continuation (Double Top Plays Out)
Failure below 26,000 leads to renewed selling toward 24,000 and potentially 23,500.
Range Expansion
Price oscillates between 24,600 and 26,000 while market waits for macro catalysts.
Bullish Invalidation
Acceptance above 26,200 negates the double top and opens path toward 27,000+.
Estimated Probability Table
| Scenario | Description | Estimated Probability |
|---|---|---|
| Bearish continuation | Lower high → retest 24,000 | 45% |
| Range consolidation | 24,600–26,000 rotation | 30% |
| Bullish breakout | Weekly close above 26,200 | 25% |
Final Takeaway
The 26,000–26,200 level has now proven itself as major resistance.
The double top is still valid.
Unless buyers reclaim that level, this structure favors:
Correction or downside continuation rather than immediate breakout.
The next decisive move will likely come from the resolution of this 24,600–26,000 range.
This analysis is for educational and informational purposes only and does not constitute trading advice or a recommendation to buy or sell any futures contracts. Futures trading involves significant risk and may not be suitable for all investors. Always conduct your own research and consult with a licensed financial professional before making trading decisions.