- NQ rallies as the Dollar falls, looking at ways we can capitalize.
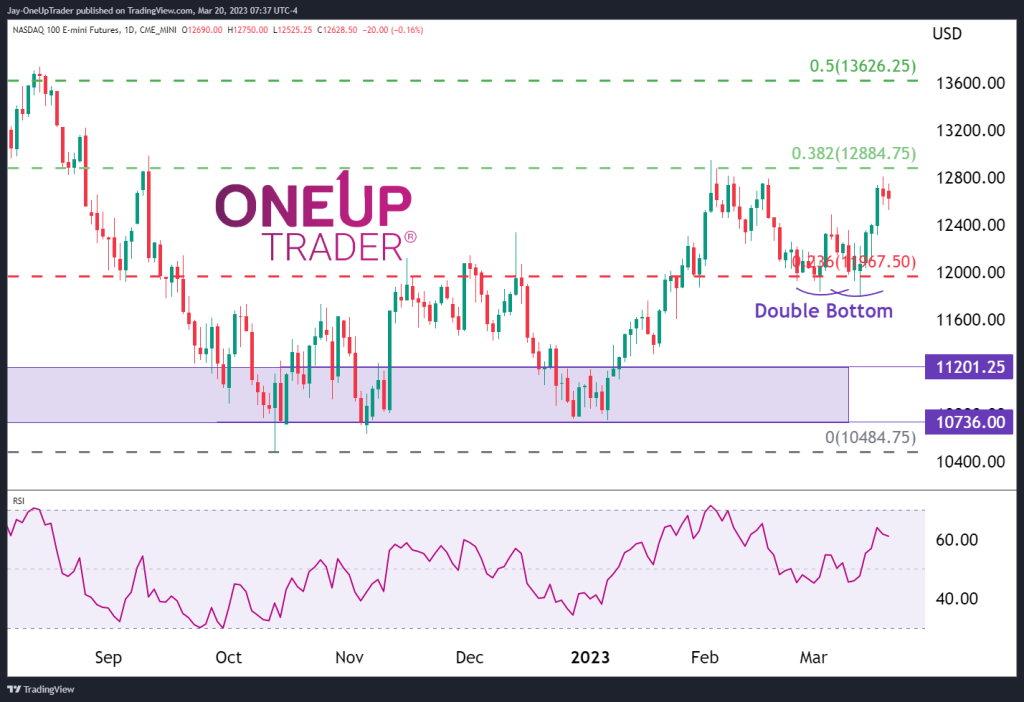
- The Fibonacci levels play a significant role in target management.
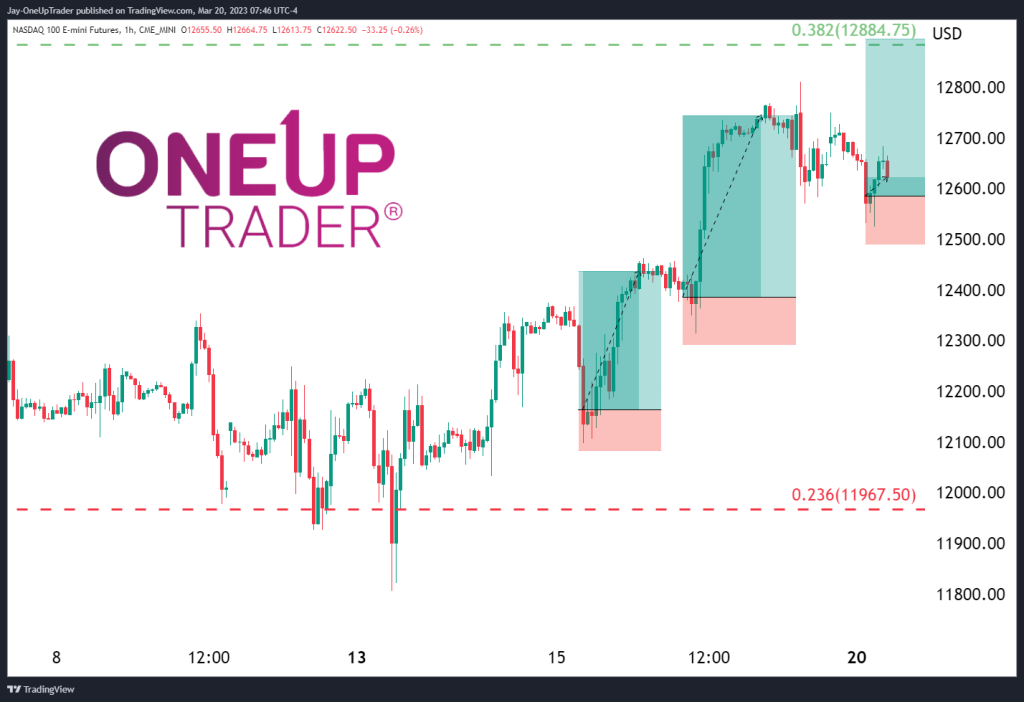
- Trend following on the hourly chart.
NQ rallies, Dollar falls
Nasdaq has rallied off the 0.236 Fib level at $11,967.50. There was a significant amount of support at this level even after we saw the Dow and Russell 2000 drop. ES and NQ have slightly decoupled from the other equity markets and are holding stronger for the time being.
Outlook
It is proving difficult in this market environment to make calls, and that is usually a sign to step away for a while. With that being said, there are a few outcomes we can concentrate on with regard to NQ as long as we remain in a probabilistic frame of mind.
NQ is close to testing the 0.382 Fib level at $12,2884, and if we see a break of that level, then the next bullish target will be the 0.50 level at $13,626.25. There should be some resistance as we approach $12,884.75, however. (NQ is currently trading at $12,640 at the time of writing.)
If we see a significant amount of resistance and the fundamentals remain in line, then a sell-off toward the 0.236 level ($11,967.50) will be the first bearish target.
The chart is bullish at the moment, and only once we see a potential reversal in the form of a candlestick pattern or chart pattern could we consider turning bearish.
Trend following on hourly chart
Buying dips on the hourly chart has been fruitful during this NQ price action. Traders should consider adopting the approach, making sure they are not chasing the market higher.