

Introduction
U.S. equity markets continue to show strength, and the Nasdaq 100 E-mini Futures (NQ) remain at the forefront. Price is now approaching all-time highs again, and bulls are regaining the upper hand after a period of consolidation since October.
The main thing driving risk assets is when the Federal Reserve will start cutting interest rates in 2026, and by how much. Recent inflation data, like December’s CPI, showed prices are still too high. Because of that, markets now expect rate cuts to come later than they did before. Some traders think the first cut may not happen until June or later, and there’s only about a 40% chance of a cut by April. The timing of these cuts will have a big impact on stock prices, especially tech stocks.
For now, let’s take a closer look at the technicals and what we can learn from them.
Market Structure & Trend
Weekly chart
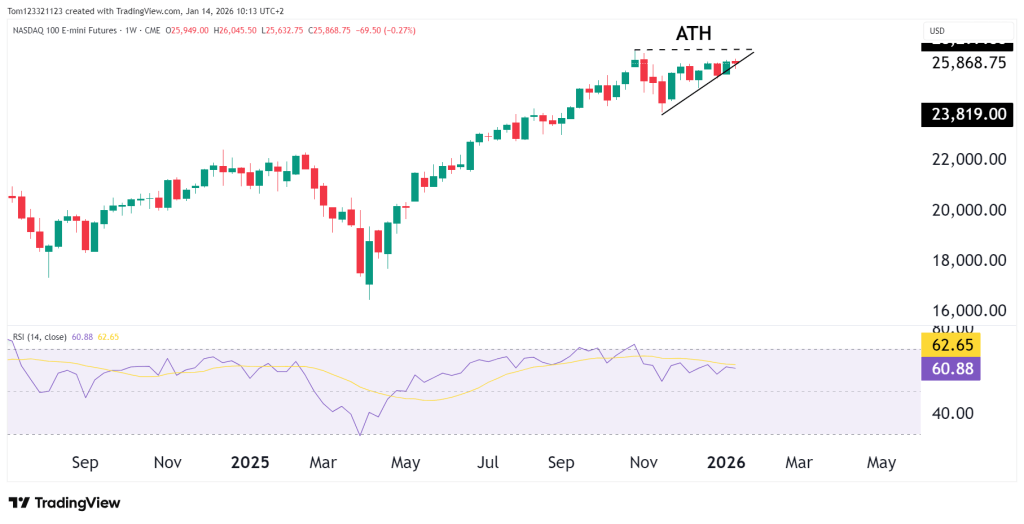
The weekly chart shows just how strong the uptrend has been since April. The pullbacks have been shallow, lasting now longer than 1 – 2 weeks. Any red week, bulls took advantage of and bought the low, leading to a 60% rally since then.
RSI on the weekly chart is holding comfortably above the 50 level, reflecting sustained bullish momentum. While momentum has cooled slightly near ATHs, there are no clear signs of structural weakness at this stage. With the formation of a small ascending trianlge, a bullish break above the high could lead to price targeting 29,000.
🎯 Ready To Get Funded?
Start your 7-day free $100K evaluation with OneUp Trader and take the first step toward becoming a funded trader.
Start Evaluation Now →Daily chart
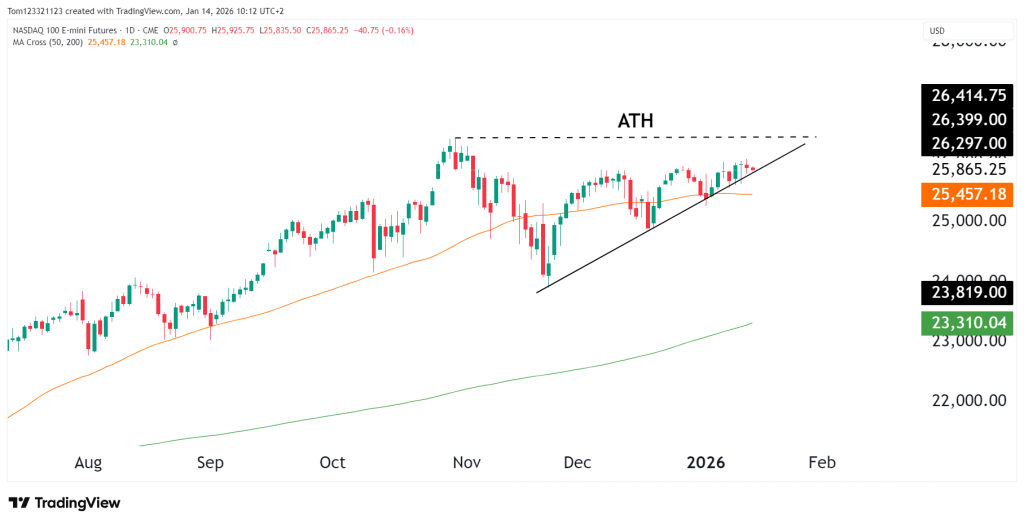
On the daily timeframe, we can take a closer look at the trend and moving averages.
The market has made several attempts to push higher, but sellers have so far capped price just under resistance. The profit taking is normal behaviour around the highs, followed by a period of lower volatility as the market waits for a clearer entry time and direction.
The 200-day moving average remains well below the price, any movement down there would be a big shift in momentum and would need a black swan event for it to occur.
Key Technical Levels
Resistance
- 26,300–26,400: Immediate all-time high resistance zone
- 26,700–27,000: Psychological upside extension if ATH is cleared
A sustained break above the ATH would likely trigger momentum-driven continuation.
Support
- 25,450–25,500: 50-day MA and trendline support
- 24,800–25,000: Prior breakout zone and daily structure
- 23,800–24,000: Major weekly support and trend-defining level
As long as price holds above the 50-day MA, pullbacks remain corrective within the broader uptrend.
Looking Forward
Bullish continuation:
Price holding above the ATH zone opens the door for a trend extension toward the 26,700–27,000 area as momentum traders re-engage.
Sideways consolidation:
Price remains range-bound between 25,500 and ATHs, allowing moving averages and momentum to catch up to price.
Deeper pullback:
A break below the rising trendline and 50-day MA could trigger a retracement toward the 24,800–25,000 support area while still maintaining the bullish structure.
Estimated Probability Table
| Scenario | Description | Estimated Probability |
|---|---|---|
| Bullish continuation | Break and hold above ATH | 45% |
| Range consolidation | Holding above 25,500 support | 35% |
| Deeper pullback | Retrace toward 24,800 | 20% |
Fundamentals to Watch
NQ is still being pushed higher by strong performance in tech and growth stocks. Investors are excited about artificial intelligence, continued spending on cloud services, and the idea that new technology will help companies become more productive and profitable. On top of that, expectations that interest rates may be cut later in the year are helping support growth stocks, which tend to benefit more when rates eventually come down.
However, with NQ already trading at all-time highs, the market is more sensitive to new information than usual. Inflation data, jobs reports, moves in Treasury yields, and comments from the Federal Reserve can all quickly change sentiment. Big earnings reports from major Nasdaq companies will also matter a lot. They will help decide whether prices can comfortably stay above these record levels, or if the market needs to pause and move sideways before the next leg higher.
This analysis is for educational and informational purposes only and does not constitute trading advice or a recommendation to buy or sell any futures contracts. Futures trading involves significant risk and may not be suitable for all investors. Always conduct your own research and consult with a licensed financial professional before making trading decisions.