

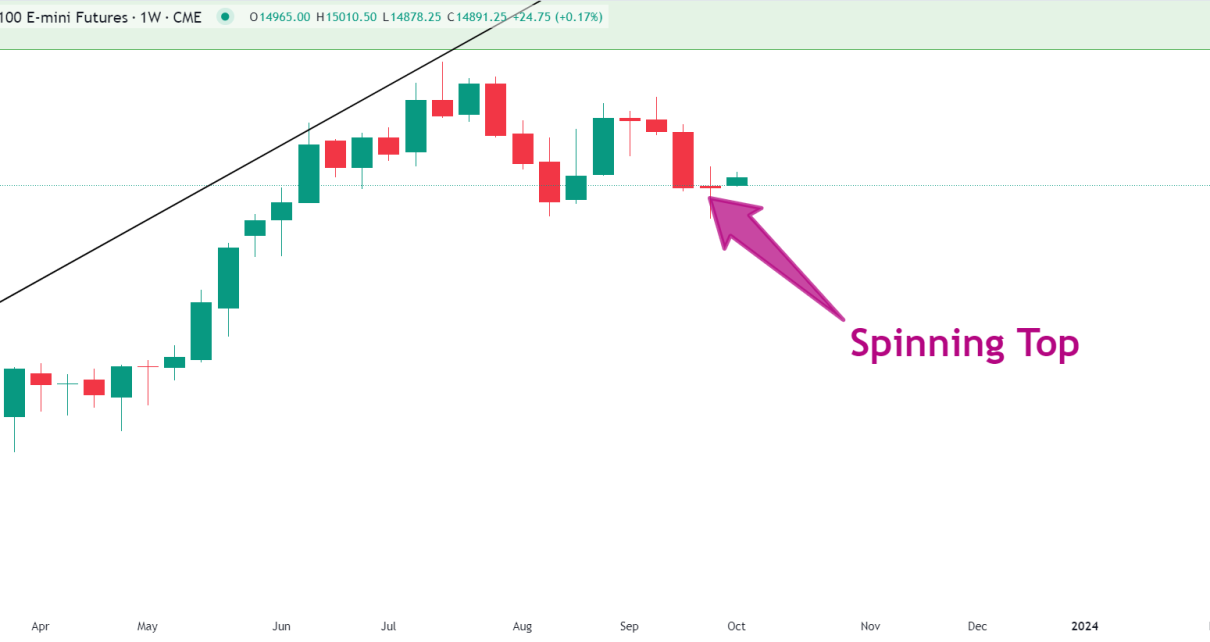
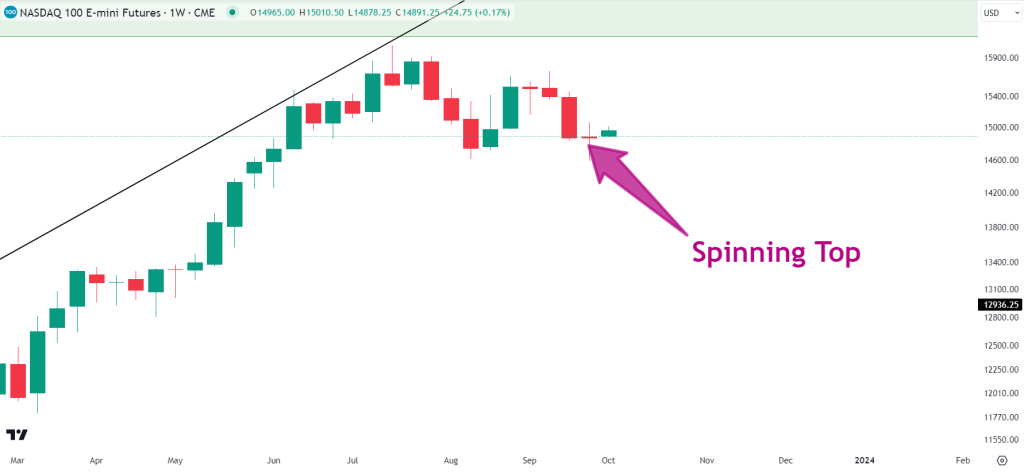
- The weekly chart closed as a spinning top last week.
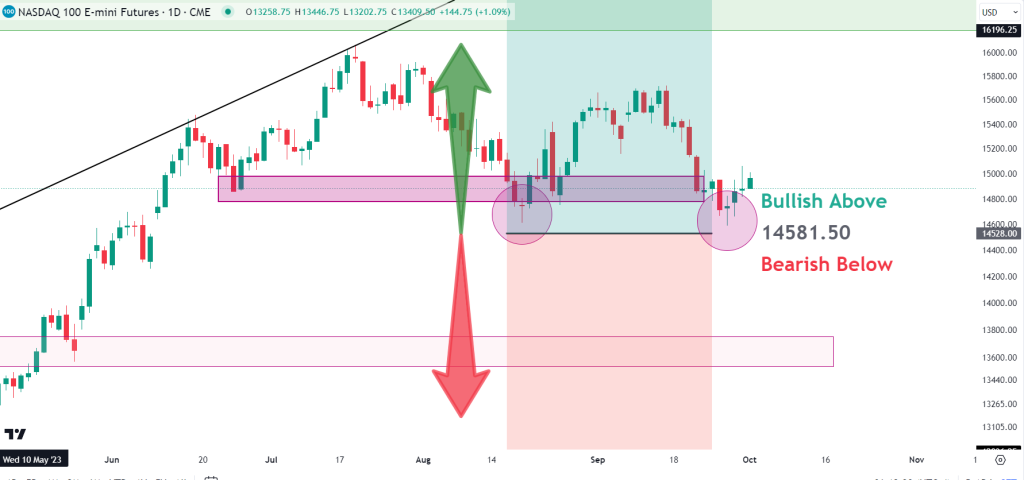
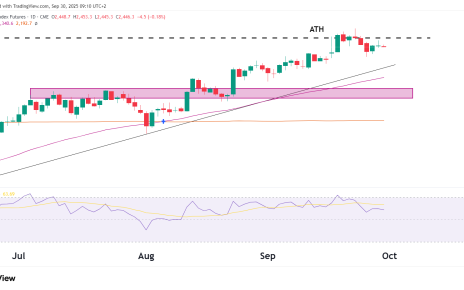
- The daily chart shows bulls still have the upper hand.
- Bullish above $14,581.50 and bearish below it.
Introduction
Last Friday NQ closed the week’s session in the form of a spinning top. The price action is mixed, but there is a case that looks stronger for bulls than for bears from here. The reason is due to the large uptrend we have seen in equities this year, as well as the small retracement that NQ has recently experienced. This spinning top comes at the bottom of a 10% retracement after a 53% rally. This is why the probabilities seem firmly in the bull’s favor.
Is this a buying opportunity?
Grinding down to the daily chart, we are still above the $14,581.50 level, which we noted in our previous analysis was the critical level that we would remain bullish above. The support level above $14,581.50 is strong as price bounced from it last week. Once again, any move below this level could lead to a significant sell-off.
