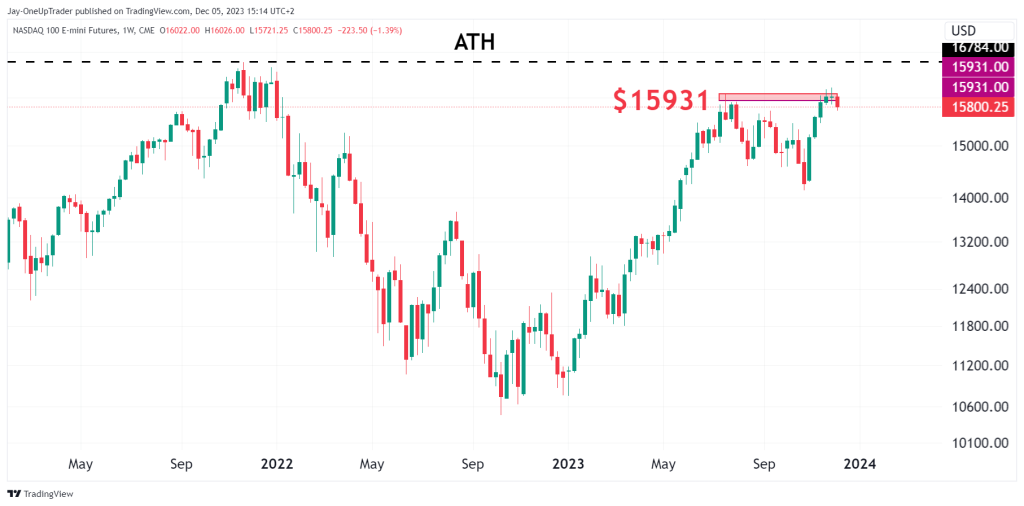
- The weekly chart shows 5 weeks straight of green candles, but this week might be different.
- Daily chart analysis with the 50 and 100 moving averages offering support.
- Levels to watch.
Weekly Chart
The weekly chart has seen 5 green weeks in a row, but this week has started off differently as NQ price rallied into a resistance zone at $15931, and price immediately began to sell off. Last week’s spinning top close is also a worry for the Bulls, but they will hope it is just a short-term hurdle on the way to all-time highs.
Daily Chart
The daily chart shows the rounding off of that high from last week. The 50 moving average is clearly above the 100 moving average and this tells us that the daily chart is firmly bullish. There is a slight hint of bearish divergence but nothing that screams reversal. From here, it appears that NQ might run into some sideways action as the bulls take some profit but there is no immediate sign of a reversal right now.
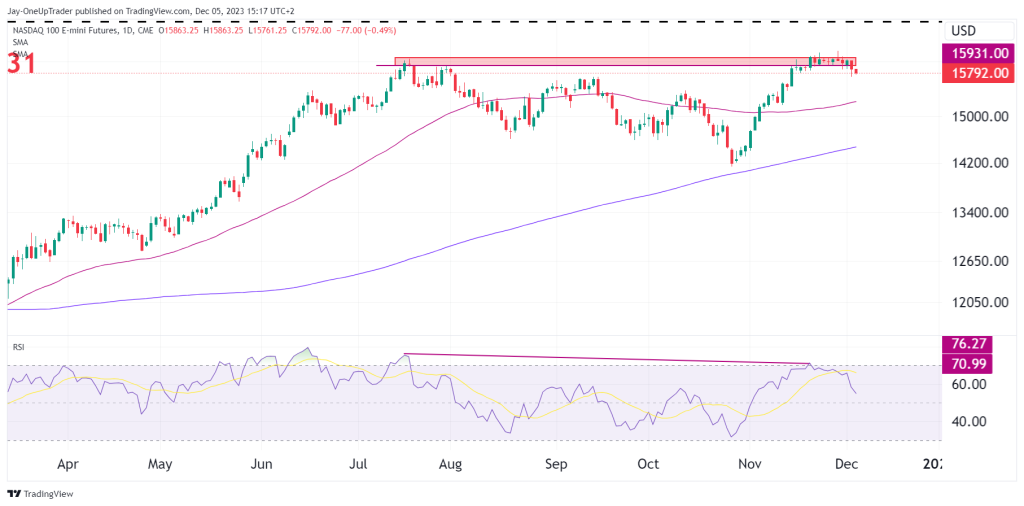
Levels To Watch
The $15932 resistance level is the most important right now and bulls need to see that level clear before all-time highs can come into the picture. A drop from current prices sets the first support at the 50 moving average and then possibly the 100 moving average from there if prices continue to fall further.