Current Market Snapshot:
- Current Price: 18,847.25
- Day’s Change: +462.25 (+2.51%)
- Key Support: 17,000 – 17,300 zone
- Immediate Resistance: 19,000 – 19,500
- Indicators: RSI = 48.12 (neutral zone), near 50-mark
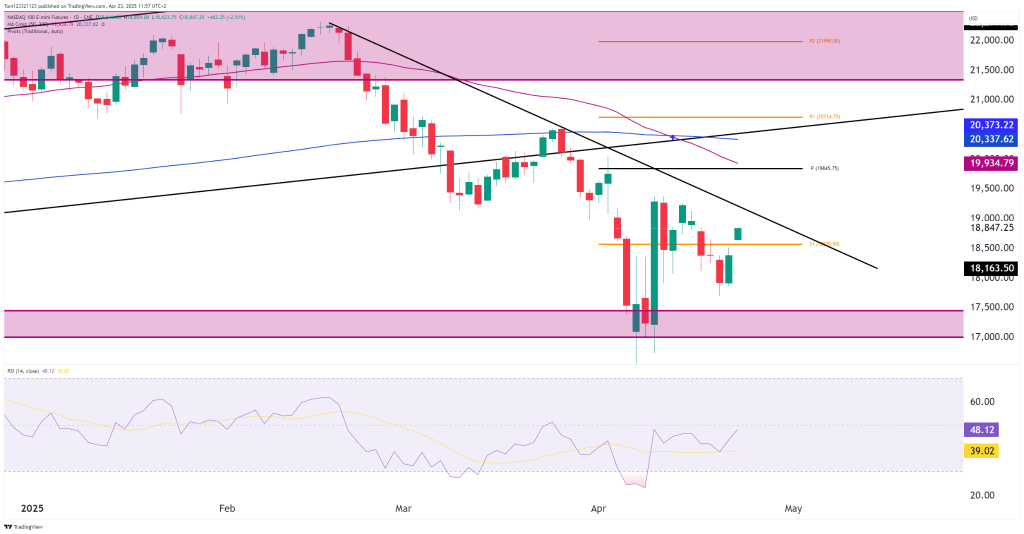
Chart Technicals
Double Bottom Formation Emerging
- The most striking technical development is the double bottom formation near 17,300.
- This is supported by strong bullish reaction candles and wicks rejecting lower prices.
Downtrend Break Under Scrutiny
- Downtrend line could be tested soon to see if the bearish strength will continue or a reversal is on the cards.
Moving Averages
- The 50-day SMA (19,934.79) and the 100-day SMA (20,337.62) are still above price, capping rallies.
- However, the price has broken above the pivot zone (S1: 18,370.50), a small but notable victory for bulls.
🐂 Bullish Scenario
If NQ can break and close above the descending trendline and 19,000, we have a confirmed breakout of the short-term downtrend channel.
Targets on the upside:
- 19,845.75 (Pivot Point) → reclaiming could be a major momentum shift
- 20,373.22 (R1 and upper channel resistance)
- 21,000+ (macro resistance zone) if macro sentiment turns risk-on
This setup would turn the recent price action from a bounce into a trend reversal, especially with broader tech showing some resilience.
🐻 Bearish Scenario
Failure to break above 19,000 resistance may result in price drifting back into the 18,100–18,300 support area, or worse:
- Retesting the double bottom support near 17,300
- A confirmed breakdown of that level could open the door to S3 at 16,626 or even S4 at 15,151.
The bear trend remains intact until we see a decisive reclaim of both trendline and 50/100-day MAs.
Summary Table
| Indicator/Zone | Status | Outlook |
|---|---|---|
| Price Action | Forming double bottom | ✅ Bullish pattern forming |
| Trendline | Still intact | ⚠️ Breakout pending |
| 50/100-Day MAs | Overhead resistance | ❌ Not yet reclaimed |
| RSI | Rising to neutral | ✅ Improving momentum |
| Volume & Conviction | Lacking confirmation | ❌ Needs follow-through |
Outlook
| Timeframe | View | Trigger Level |
|---|---|---|
| Short-Term | Neutral-Bullish | Close above 19,000–19,200 |
| Medium-Term | Bearish to Reversal | Needs 20,000+ reclaim |
| Long-Term | Still in structural uptrend | 17,000 is make-or-break support |
Final Thoughts
Bulls must defend the momentum and force a breakout above the downtrend line and 19,000-19,200 resistance. Until then, either a failed rally (dead cat bounce) or a trend reversal catalyst is here.
If the macro backdrop (such as inflation, earnings, and geopolitics) supports risk-on flows, this could be the start of a broader relief rally.