

Important Points
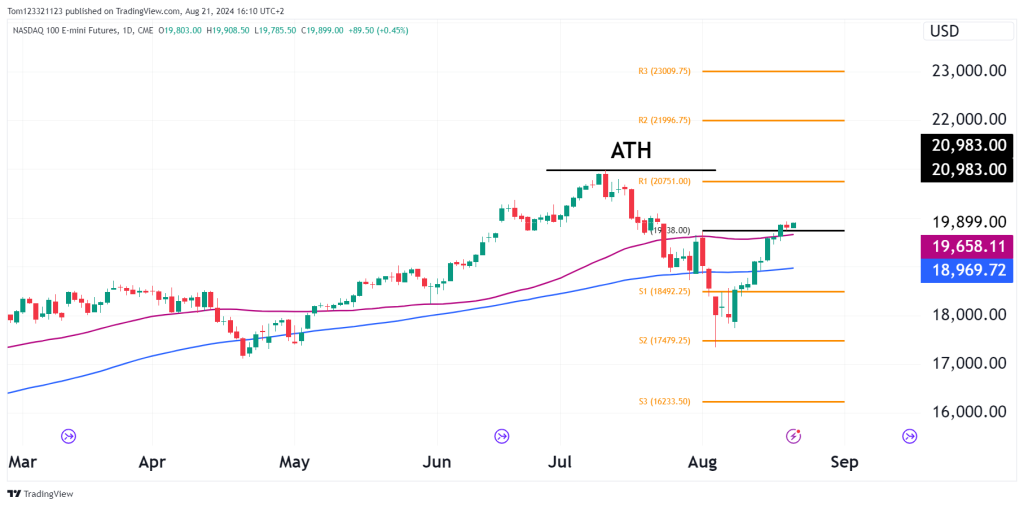
All-Time High (ATH) Resistance:
- The chart shows that the price is approaching the previous All-Time High (ATH) level. This level is marked as a significant resistance zone and bulls need to see price rally above this in order for the bull market to continue.
Support and Resistance Levels:
- Resistance Levels: R1 (20,751), R2 (21,996.75), and R3 (23,009.75) are plotted above the current price, these are targets if the price breaks above the ATH.
- Support Levels: S1 (18,492.25), S2 (17,479.25), and S3 (16,233.50) provide potential areas where the price might find support if it retraces.
Price Action:
- The price has recently rebounded from the S1 and S2 support level and is now showing strength as it approaches the ATH resistance.
- The bullish candlesticks indicate a continuation of upward momentum, with buyers in control.
Trade Opportunities:
Bullish Scenario:
- Breakout Trade: If the price breaks above the ATH with strong volume, it could signal a bullish breakout, leading to a potential move towards R1 (20,751) and beyond to R2 (21,996.75). Traders could consider going long on a confirmed breakout above the ATH.
- Pullback Entry: If the price retraces to test the low after a breakout and holds this level as support, it could be a good opportunity to enter long positions, aiming for the resistance levels mentioned.
Bearish Scenario:
- Rejection at ATH: If the price fails to break above the ATH and shows signs of rejection (e.g., bearish candlestick patterns like a shooting star or bearish engulfing), it could indicate a potential reversal or correction. Traders could consider short positions, targeting S1 (18,492.25) or lower.
- Mean Reversion: If the price starts to revert to the mean (50-day moving average), a short-term bearish trade could be considered, especially if the price action suggests weakening bullish momentum.
Risk Management:
- Stop Losses: For long positions, a stop loss could be placed just below the low level or the 50-day moving average, depending on the entry point. For short positions, a stop loss above the ATH or recent swing high would be prudent.
- Take Profit Levels: Utilize the resistance and support levels (R1, R2, S1, S2) as potential take profit zones.
Final Call:
- Short-Term (Next few days): Neutral to Bullish. Watch for a breakout above the ATH for a possible long entry.
- Medium-Term (Next few weeks): Bullish, especially if the ATH is breached and held as support.
- Long-Term (Next few months): Bullish, considering the upward trend and strong support from moving averages.
Overall, the chart is showing a bullish bias, with a key decision point around the ATH. Traders should watch for either a breakout or a rejection to determine the next move.
