Introduction
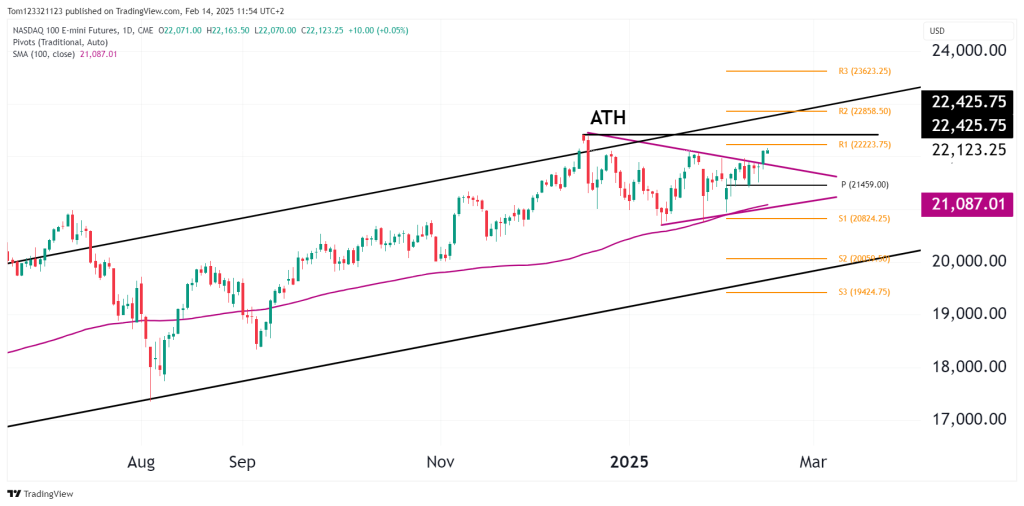
The NASDAQ 100 E-mini futures (NQ) have broken out of a symmetrical triangle pattern. After weeks of consolidation, price action shows that buyers are regaining control, pushing NQ towards its all-time high (ATH) of 22,425.75.
As of today, NQ is trading at 22,135.75, up +0.10%, holding above key support levels. The breakout above the triangle resistance and the 100-day SMA (21,087.13) strengthens the bullish case, while traders now focus on macroeconomic factors that could drive the next move.
Market Drivers & Key News Events
Several global and U.S. economic factors are influencing the NASDAQ 100’s breakout attempt:
- CPI & Fed Rate Expectations: The latest U.S. CPI inflation data indicated slightly higher-than-expected inflation, leading to some uncertainty about how soon the Federal Reserve could begin cutting rates. Despite this, tech stocks have remained resilient as investors anticipate easing monetary policy later in 2025.
- Earnings Season: Major tech giants have reported strong earnings, with AI-related stocks continuing to drive bullish sentiment. Companies like NVIDIA, Microsoft, and Alphabet have seen renewed buying interest.
- Geopolitical Risks: Market volatility has remained moderate despite ongoing geopolitical tensions in global markets. However, any risk-off sentiment could lead to short-term pullbacks.
Technical Outlook
Bullish Breakout from Triangle Pattern
- NQ has broken above the symmetrical triangle resistance, a key bullish signal.
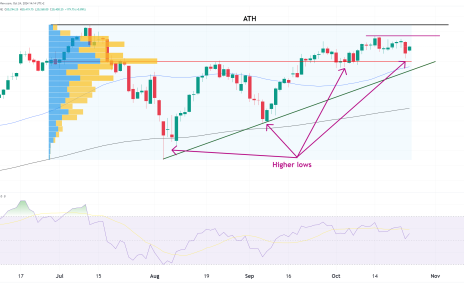
- Price remains in a long-term rising channel, with higher highs and higher lows intact.
- The 100-day SMA (21,087.13) is dynamic support, reinforcing the uptrend.
Key Support & Resistance Levels
- Resistance Levels:
- 22,425.75 (All-Time High – Key Breakout Zone)
- 22,858.50 (R2 Pivot – Next Upside Target)
- 23,623.25 (R3 Pivot – Extended Bullish Target)
- Support Levels:
- 21,459.00 (Pivot Point – Must Hold for Bulls)
- 21,087.13 (100-day SMA – Major Dynamic Support)
- 20,824.25 (S1 Pivot – Deeper Support Zone)
If NQ clears 22,425.75, it could trigger a strong bullish breakout toward the R2 and R3 pivot levels. However, a failure to hold above 21,459.00 could lead to a short-term retest of lower support.
Bull & Bear Scenarios
Bull Case: Breakout Above ATH & Run to 23,000+
- A move above 22,425.75 would signal a new bullish leg, targeting 22,858.50 and 23,600.
- Strong earnings, AI sector strength, and rate-cut expectations could fuel further upside momentum.
Bear Case: Fake Breakout & Drop Below 21,459.00
- A rejection near ATH could lead to a pullback toward 21,087.13 (100-day SMA).
- A breakdown below 20,824.25 (S1 Pivot) would invalidate the bullish trend, opening the door to 20,000.
Final Outlook
- Short-Term (1-2 Weeks): Bullish, targeting 22,425.75 (ATH) and 22,858.50 (R2 Pivot).
- Medium-Term (1-3 Months): Bullish as long as price remains above 21,087.13 (100-day SMA).
- Long-Term (6+ Months): Bullish unless NQ falls below 20,000.00, which would indicate a deeper correction.