

Gold has always held a special allure, and in the financial markets, it is no different. Currently, Gold Futures are exhibiting strength, as indicated by the recent push towards and beyond the $2,089 level as it broke above all-time highs.
On the weekly chart, the precious metal has overcome significant resistance, marked by the ‘Previous ATH’, suggesting a new support level could form here. The consistent higher lows since 2021 indicate a long-term uptrend, supported by the upward-sloping trend line.
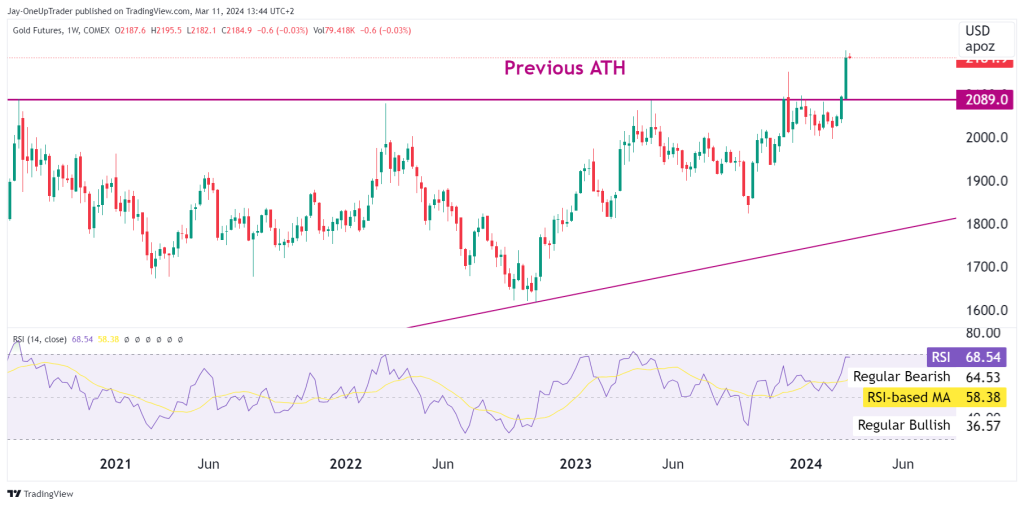
The Relative Strength Index on the weekly timeframe is in bullish territory, hovering above 68, signaling sustained buying pressure, although not yet in the overbought region. This could imply there is still room for upward movement before the market becomes overheated especially since GC has only just broken above its previous ATH.
Shifting focus to the daily chart, Gold’s price sits comfortably above both the 50-day Simple Moving Average at around $2,054 and the 200-day SMA at approximately $1,986, reinforcing the bullish sentiment. Additionally, the Moving Average Convergence Divergence (MACD) shows increasing bullish momentum, with the MACD line well above the signal line and a growing histogram.

Potential Trades:
- Bullish Scenario: Given the recent breakout, a potential trade could be to go long on gold with a target of the next psychological level, possibly around $2,200. A stop-loss could be placed just below the current support level at $2,089 to manage risk if the price retreats.
- Pullback Trade: Traders could also wait for a pullback to the $2,089 level, which might act as a new support, and enter a long position from there, targeting the same $2,200 level, with a stop-loss placed below the 50-day SMA to protect against a deeper correction.
Overall Rating: Strongly Bullish. The trend is clearly up, and both the MACD and moving averages support this bullish sentiment. The market shows no immediate signs of a reversal, making the bull scenario more likely in the near term. However, traders should keep an eye on the MACD for any signs of divergence that might signal a slowing in momentum and use stop-loss orders to protect against unforeseen market reversals.